

Abstract
Poststroke aphasia (PSA) results from direct effect of focal lesions and dysfunction of distributed language networks. However, how flexible the activity at specific nodes control global dynamics is currently unknown. In this study, we demonstrate that alterations in the regional activity may cause imbalances between segregation and integration in temporo‐spatial pattern, and the transient dynamics are disrupted in PSA patients. Specifically, we applied dynamic framework to eyes‐closed resting‐state functional MRI data from PSA patients (n = 17), and age‐, gender‐, and education‐matched healthy controls (HCs, n = 20). Subsequently, we calculated two basis brain organizational principles: “dynamic segregation,” obtained from dynamic amplitude of low‐frequency fluctuations (dALFF), which represent the specialized processing within interconnected brain regions; and “dynamic integration,” obtained from dynamic functional connectivity, which measures the efficient communication between interconnected brain regions. We found that both measures were decreased in the PSA patients within the left frontal and temporal subregions compared to the HCs. PSA patients displayed increased flexibility of interaction between left temporo‐frontal subregions and right temporo‐parieto‐frontal subnetworks. Furthermore, we found that dALFF in the pars triangularis of left inferior frontal gyrus was associated with aphasia quotient. These findings suggest that the reduced temporal flexibility of regional activity in language‐relevant cortical regions in PSA is related to the disrupted organization of intrahemispheric networks, leading to a loss of the corresponding functions. By using dynamic framework, our results offer valuable information about the alterations in segregation and integration of spatiotemporal information across networks and illuminate how dysfunction in flexible activity may underlie language deficits in PSA.
Keywords: dynamic integration, dynamic segregation, poststroke aphasia, resting‐state functional magnetic resonance imaging
1. INTRODUCTION
Focal damage due to stroke usually causes a collection of language disruptions in phonological processing as well as semantic and executive‐cognition functions; this condition is called poststroke aphasia (PSA; Butler, Lambon Ralph, & Woollams, 2014). These behavioral deficits originate from the disruption of regions local to the lesion site as well as the dysfunction of interconnected remote regions within the language network (Carrera & Tononi, 2014). A network perspective suggests that structural lesions affect the optimal balance of integration and segregation, and these changes contribute significantly to widespread abnormalities of network coherence that are related to behavioral deficits (Adhikari et al., 2017; Klingbeil, Wawrzyniak, Stockert, & Saur, 2019; Siegel et al., 2016).
Characterizing integration by mapping functional connectivity between brain regions refers to the temporal correlation of neurophysiological neural signals as recorded by using indirect measures, such as positron emission tomography (PET) and functional magnetic resonance imaging (fMRI), or with direct measures such as magnetoencephalography (MEG) and electroencephalogram (EEG; Biswal, Yetkin, Haughton, & Hyde, 1995; Fox & Raichle, 2007). Using resting‐state fMRI (rs‐fMRI), abnormalities of the intrinsic functional organization (i.e., integration) in left‐lateralized wide‐spread networks of closely connected regions in the frontal, temporal, and parietal lobe have been investigated in PSA (Kiran, 2012). Disrupted functional connectivity (FC) in corresponding networks significantly account for behavioral deficits in stroke with language disruptions (Carter et al., 2010; Siegel, Ramsey, et al., 2016). An implicit assumption of these studies is that alterations of integration measured by FC within and between the large‐scale language networks facilitate and modulate language deficits after stroke.
FC is evaluated by co‐activation of spatially segregated functionally specialized brain regions, and is extensively defined as functional networks (Amemiya, Takao, Hanaoka, & Ohtomo, 2016; Cabral, Kringelbach, & Deco, 2014; Matsui, Murakami, & Ohki, 2016). Resting‐state networks were originally characterized by indirect and slow (<0.1 Hz) neural activity (Buzsaki & Draguhn, 2004), which could be captured by the amplitude of low‐frequency fluctuations (ALFF) index using blood oxygen level‐dependent (BOLD) fMRI. Previous studies showed that variability in measured BOLD signal contributes to intertrail human behavior (Pessoa, Gutierrez, Bandettini, & Ungerleider, 2002; Rees, Backus, & Heeger, 2000; Wagner et al., 1998). The ALFF identifying localized activity in a distinct cortical region might be of particular significance to reflect certain aspects of functional processing within the network. This specialized information processing among interconnected brain regions within networks could be termed as functional segregation (Rubinov & Sporns, 2010). Such local property allows for functional isolation of a particular region from surrounding cortex (Grefkes & Fink, 2011) and is thought to be fundamental for mental processing and cognition (Deco, Tononi, Boly, & Kringelbach, 2015). Abnormity in the patterns of spontaneous activity have been reported in a large number of pathological states, such as schizophrenia (Bluhm et al., 2007), depression (Anand et al., 2005), and Alzheimer's disease (Greicius, Srivastava, Reiss, & Menon, 2004). Hence, relating the disturbed patterns of ALFF to underlying differences in segregation provides the specificity of the observed behavior, which may be serve as a functional localizer in neuropsychiatric diseases. These spatial patterns of spontaneous activity during rest are thought to be on the basis of the underlying anatomical structure (Bullmore & Sporns, 2009). In view of the fundamental role of neuroanatomical connectome in determining some features of functional networks, damage to structural connectome resulting from stroke may influence the brain activity not only near the lesion site, but also at the whole‐brain scale (Saur et al., 2006). These pathological disturbances in spontaneous activity have also been physiologically correlated with construction deficit (Yang et al., 2016) and recovery of naming ability (van Hees et al., 2014) in PSA participants. However, only probing localized activity in a distinct cortical region does not clarify how spatially distributed regions interact and mediate information as an integrated system. At the local level, activity in individual region plays particularly important role in coordinating and integrating information has already been described in relation to different experimental procedures (Bertolero, Yeo, & D'Esposito, 2015; Honey & Sporns, 2008). In resting state, the predominance of activity could affects FC organization throughout the brain networks (Allen et al., 2014; Doucet et al., 2012). As the brain networks strike a balance between integration and segregation, perturbing specialized functional processing would undoubtedly lead to insufficient global integration (Deco et al., 2015). Therefore, probing the effects of low‐frequency spontaneous activity in terms of placing constraints on FC may help to uncover how the abnormal segregation influence the integration in language deficits of stroke patients.
In most of the previous studies, assessment of brain activity and associated connectivity is limited by a general assumption of spatial and temporal “static” during the scan (Li, Duan, Cui, Chen, & Liao, 2019; Liao et al., 2019). However, statics are considered as the average (i.e., mean) quantities assuming that the brain remains constant in the resting state (Chang & Glover, 2010). An emerging area of study is dynamics, which can be explored by measuring temporal flexibility (i.e., variability) in the spontaneous fluctuations of activity and connectivity. A key motivation for such analyses is that dynamics can capture uncontrolled but reoccurring patterns of brain networks, which cannot be detected through static analyses (Ma, Calhoun, Phlypo, & Adali, 2014). Dynamics are especially important during resting periods where mental activity is unconstrained (Chang & Glover, 2010; Fu et al., 2018). These methods are reproducible across time and with different subjects and have shown fine segregation between healthy subjects and patients (Guo, Duan, Suckling, Chen, & Chen, 2018; Li et al., 2019; Liao et al., 2014; Ma et al., 2014; Wei et al., 2018), suggesting that dynamic properties may provide useful diagnostic and prognostic information. Thus, explicit investigations of resting‐state dynamics allow the identification of temporal flexibility in spontaneous activity and FC, which could complement those of static alterations in cognitive and pathological states. Brain networks are adaptive networks in which the topology could self‐organize in time based on local activity toward optimal information interaction in response to environmental demands (Gross & Blasius, 2008). It is therefore likely that brain functional networks should be regarded as a dynamic system that self‐organize with co‐evolutionary local activity and FC. This theory has received further support from computational modeling, which shows that both spontaneous neural activity and connectivity are coordinated via complete anatomical structure at multiple time scales without external input (Chawla, Lumer, & Friston, 2000; Honey, Kotter, Breakspear, & Sporns, 2007). This dynamic property highlights the importance of complete neuroanatomical connectome toward establishing the dynamic framework that enables mutual information transfer between interconnected regions. Poststroke loss and reorganization of language functions dynamically evolve over time (Chai, Mattar, Blank, Fedorenko, & Bassett, 2016; Siegel, Ramsey, et al., 2016), resulting from the history of localized and remote pathophysiological changes. Therefore, damage from this optimal structure organization as a result of stroke is likely to cause imbalances between segregation and integration of temporo‐spatial patterns of neural activity in the fronto‐temporal language network.
Here we perform sliding‐window analysis of ALFF and FC to characterize the flexibility of network segregation and integration in PSA patients, respectively. Disruptions in the FC with‐in and between networks relating to pathology of aphasia have been extensively reported (Baldassarre, Metcalf, Shulman, & Corbetta, 2019; Sandberg, 2017; Siegel, Ramsey, et al., 2016). Thus, we only determine the relationship between dynamic ALFF changes and the clinical language scores of patients. Given that stroke has a comorbid vascular etiology, accumulating evidence (Saur et al., 2006; van Hees et al., 2014) have revealed attenuations of BOLD signal in language specific regions in the ipsilesional hemisphere. We hypothesize that, in PSA participants, focal lesions due to stroke may cause reduction in functional segregation and disturbances to integrate their activity into dynamically coherent language network. Hypoactivity of the regions in the left‐lateralized language networks should be responsible for corresponding clinical language deficits.
2. MATERIALS AND METHODS
2.1. Subjects
Resting‐state fMRI dataset from seventeen participants (age: 53.53 ± 14.06 years old; secondary to single left‐hemisphere ischemic (n = 15) or hemorrhagic (n = 2) stroke (lesion size: 28.85 ± 42.84 cm3); psychoactive medication‐free) exhibiting first‐ever stroke were recruited from admission at Fuzhou Hospital. The inclusion criteria were as follows: (a) first symptomatic stroke occurred in the left hemisphere, ischemic, or hemorrhagic etiology; (b) persistent aphasia at Day 1 poststroke; (c) awake, alert, and able to participant in the research; (d) native Chinese speakers; and (e) right handed. The exclusion criteria were as follows: (a) the inability to maintain wakefulness during research; (b) previous stroke based on clinical imaging; (c) multifocal stroke; (d) brain injury; (e) psychiatric disorders/conditions (e.g., schizophrenia) or substance abuse valuated by Structured Clinical Interview from the Diagnostic and Statistical Manual of Mental Disorders, Fourth Edition (Structural Clinical Interview of DSM‐IV) that may alter the interpretation of the study; (f) dementia, Parkinson disease, or other neurologic disorders; and (g) claustrophobia or contraindications to MRI. All patients experienced a single left hemisphere stroke at the end of the acute stage (mean time poststroke: 9.72 days) (Klingbeil, Wawrzyniak, Stockert, & Saur, 2019).
All participants with PSA received a comprehensive evaluation, including medical history, neurological examination, neuropsychological testing, and neuroimaging. PSA patients also completed a battery of standardized language tests to provide a complete language profile. Aphasia was diagnosed based on the Aphasia Battery of Chinese (ABC), which is the Chinese standardized adaptation of the Western Aphasia Battery (Gao, et al., 1992). The composite indices were extracted as the aphasia quotient (AQ), performance quotient (PQ), and cortical quotient (CQ). AQ reflects the global measure of severity and type of aphasia. AQ is derived from linguistic subtests including spontaneous speech, auditory comprehension, repetition, and naming. PQ combines scores of reading/writing, praxis, and construction (Drawing, Block design, numerical calculation, and Reven's colored matrices score; Hécaen, 1981). CQ is a more general measure of cortical function that provides an overall picture of cognitive status (Yu et al., 2013). Demographic and stroke‐related clinical characteristics are shown in Table 1.
Table 1.
Demographic and clinical characteristics for the participants
| Aphasia (n = 17) | HC (n = 20) | Aphasia vs. HC | |
|---|---|---|---|
| Mean ± SD | Mean ± SD | p value | |
| Gender (male/female) | 11/6 | 12/8 | .77a |
| Age (years) | 53.53 ± 14.06 | 54.05 ± 8.43 | .89b |
| Education (years) | 8.71 ± 1.26 | 8.45 ± 1.47 | .58c |
| Handedness (left/right) | 0/17 | 0/20 | ‐ |
| Time poststroke (days) | 9.72 ± 5.30 | ||
| Lesion size (cm3) | 30.60 ± 42.23 | ||
| ABC scores | ‐ | ‐ | |
| Aphasia quotient (AQ) | 40.88 ± 13.57 | ‐ | ‐ |
| 93.25d | |||
| Spontaneous speech score | 8.82 ± 6.74 | ‐ | ‐ |
| Auditory comprehension score | 145.12 ± 47.16 | ‐ | ‐ |
| Repetition score | 87.53 ± 23.67 | ‐ | ‐ |
| Naming score | 36.94 ± 33.50 | ‐ | ‐ |
| Performance quotient (PQ) | 22.20 ± 11.13 | ‐ | ‐ |
| Reading/writing score | 90.44 ± 60.91 | ‐ | ‐ |
| Praxis score | 44.76 ± 16.41 | ‐ | ‐ |
| Construction score | 56.68 ± 28.32 | ‐ | ‐ |
| Cortical quotient (CQ) | 49.60 ± 19.55 | ‐ | ‐ |
| 90.85d | |||
Abbreviation: HC, healthy controls.
Chi‐square test.
Mann–Whitney U‐test.
Two‐sample t‐test.
Cut‐off scores based on the receiver operating curve analyses (Kim & Na, 2004).
Twenty age‐, gender‐, and education‐matched healthy controls (HCs; age: 54.05 ± 8.43 years, 8 females and 12 males, all right‐handed) were included in this study. The HCs were recruited by an advertisement. The HCs had no history of neurological disorders or psychiatric illnesses.
The procedures were determined by consensus between one experienced neurologist and one psychiatrist. Written informed consent was obtained prior to the investigation. The study was conducted in accordance with the protocol and guidelines approved by the Ethics Committee of Fuzhou Hospital.
2.2. Data acquisition
Scanning was performed using a 3.0 T Siemens Vision Scanner (Erlangen, Germany), with an echo‐planar imaging (EPI) sequence with the following parameters: repetition time (TR)/echo time (TE) = 2,000/30 ms, in‐plane matrix = 64 × 64, flip angle = 90°, voxel size = 3.8 × 3.8 × 4 mm3, interslice gap = 0.4 mm, and number of slices = 31. For each participant, the rs‐fMRI scan lasted for 6 min, and 190 volumes were obtained. Foam pads and headphones were used to minimize head movement and scanner noise. All subjects were instructed to keep their eyes closed, relax, think of nothing in particular, and avoid falling asleep (confirmed by all participants immediately after the scanning). The following high‐resolution anatomical brain sequences were also acquired: 3D T1‐weighted fast field echo (TR/TE = 2,300/2.98 ms, matrix = 512 × 512, flip angle = 9°, voxel size = 0.5 × 0.5 × 1 mm3, 176 axial slices without inters‐lice gap).
2.3. Lesion mapping
We constructed a lesion overlap image for all PSA participants. The lesions were manually segmented using MRIcron software (http://www.mccauslandcenter.sc.edu/mricro/mricron) on individual structural images. After the spatial normalization process, the union of all individual lesion masks was used to construct a group lesion mask for the patients. One neurologist reviewed all segmentations to distinguish hemorrhage from surrounding edema. The lesion distribution map was presented previously (Yang et al., 2018).
2.4. Data preprocessing
Preprocessing was conducted using the DPABI toolbox (http://rfmri.org/dpabi). The first 10 volumes of each subject were discarded to allow for magnetization equilibrium and saturation effects. The remaining 180 consecutive volumes were corrected by the acquisition time delay among different slices and realigned to the first volume to correct the head motion. Subject movement was determined to ensure a head motion of less than 2.5 mm translations and 2.5° rotations. The mean frame‐wise displacement (FD) was computed (Power, Barnes, Snyder, Schlaggar, & Petersen, 2012) to reflect volume‐to‐volume changes in head position, after which the images were spatially normalized to the standard Montreal Neurological Institute EPI template and resampled to a voxel size of 3 × 3 × 3 mm3. Subsequently, the BOLD fMRI signal of each voxel was detrended to remove the linear trend. Despiking was performed by 3dDespike algorithm in Analysis of Functional Neuroimaging (AFNI, http://afni.nimh.nih.gov/afni/). Several nuisance covariates (global signal of the entire brain, and averaged signals from the cerebrospinal fluid and white matter) were regressed out from the data. Moreover, regression of the Friston‐36 parameters was conducted to control the potential influence of head motion (Ciric et al., 2017). Temporal band‐pass filtering (0.01–0.08 Hz) was performed to reduce the effects of low‐frequency drift and high‐frequency noise (Foerster, Tomasi, & Caparelli, 2010). Scrubbing regression was not performed because contiguous time points were necessary for dynamic analysis (Yan et al., 2013).
2.5. Dynamic ALFF analysis
Dynamic patterns in ALFF were characterized by using the DynamicBC toolbox (http://www.restfmri.net/forum/DynamicBC) (Liao et al., 2014), which is based on the sliding‐window approach. The full‐length time‐series was segmented into square sliding windows of 50 TRs (100 s) and shifted with a step size of 3 TRs (6 s). This procedure produced 43 windows for each subject. To validate our dALFF findings, we performed auxiliary analyses. In addition to the window length of 50 TRs (100 s), two different window lengths (30 TRs [60 s] and 100 TRs [200 s]) were tested in the following validation analysis. Detailed results are provided in Figure S1 of the Supporting Information. An ALFF map was obtained for each sliding window, and the ALFF of each voxel was standardized using z‐transformation. Then, we computed the variance of all dALFF maps across sliding‐windows and spatially smoothed these maps with a Gaussian kernel (6 mm).
2.6. Hemodynamic lag analysis
Considering that the delay in the hemodynamic response distorts FC measurement in stroke populations (Chi et al., 2018; Lv et al., 2013), we calculated and corrected the hemodynamic lag for mitigation of the effect of BOLD signal delay on the FC computation. After preprocessing, we created temporal shift maps using the method proposed in (Siegel, Snyder, Ramsey, Shulman, & Corbetta, 2016). The reference time series was generated from the average signal of each subject's nonlesion gray matter. For each voxel, we shifted the time series from −5 TR to +5 TR (−10 to +10 s). Cross‐correlation analysis was performed between the shifted time courses at each TR and the reference time series to determine the offset associated with the highest correlation coefficient with the reference signal. Each voxel was assigned a value based on the time shift required for the maximal correlation coefficient. Voxels not positively correlated with the reference signal over the range ±5 TRs (± 10 s) as well as voxels in the lesions were excluded from the region of interest and FC analyses. Then we corrected the time series to normalize the FC maps (Christen et al., 2015; Jahanian, Christen, Moseley, & Zaharchuk, 2018). At greater length, we shifted the time series of each voxel according to the previous estimated hemodynamic lags to correct the time series interpolation.
2.7. Dynamic FC analysis
Group level brain regions that showed statistically significant altered dALFF (see Section 2.8) were defined as seeds for the dFC analyses. Seed regions were placed at the peak Montreal Neurological Institute (MNI) coordinates, which were determined from the dALFF analysis using a 4 mm sphere. A sliding window approach via DynamicBC toolbox (http://www.restfmri.net/forum/DynamicBC) (Liao, Wu, et al., 2014) was used to obtain the whole‐brain dFC maps of each seed region. The window parameters were identical to those used in the dALFF estimation. In each window, whole‐brain FC maps were computed as Pearson's correlation coefficients between the average time series of each region and the time series of every other voxel in the gray matter. Voxels contained in the lesion mask (in PSA subjects) were excluded from the dFC calculation. The resulting correlation coefficients were converted to z‐scores using Fisher's z‐transformation to improve normality. Thus, a set of sliding‐window correlation maps for each PSA participant was obtained. The variance of the time series of the correlation coefficient was estimated by calculating the standard deviation of z values at each voxel to assess dFC flexibility, and the normalized dFC maps were spatially smoothed with a Gaussian kernel (6 mm).
2.8. Statistical analyses
The two‐sample t‐test was implemented on the Statistical Parametric Mapping 8 toolkit to compare differences in dALFF between aphasic patients and HCs with four covariates (age, gender, education, and mean FD). During our analysis, lesion size was also regressed out because of its strong correlation with average homotopic connectivity (Siegel, Ramsey, et al., 2016). The results of altered dALFF were identified at a threshold of p < .05 and a minimum cluster size of 19 voxels (AlphaSim‐corrected with the following parameters: single voxel p < .001 and the mask excluding lesions in PSA participants). The locations of the peak maxima of significant clusters were determined using xjView (http://www.alivelearn.net/xjview).
The same procedure was applied to achieve between‐group comparisons of dynamic interregional FC. The significance threshold was set to p < .001 at the voxel level, and AlphaSim correction at the cluster level was set to p < .05.
We used Pearson's correlation analysis to determine whether the abnormal dALFF were correlated with the clinical aphasia performance (i.e., AQ, PQ, and CQ). We performed these analyses in regions showing statistically significant between‐group difference. Bonferroni correction was used for the multiple comparisons and p < .05/3 (Bonferroni corrected) was considered to indicate statistically significant differences.
3. RESULTS
3.1. Demographic and clinical features
The demographic and clinical characteristics of the PSA and HC groups are summarized in Table 1. No significant group differences were observed in gender (χ 2‐test, χ2 = .09, p = .77), age (Mann–Whitney U‐test, U = 0.14, p = .89), and level of education (two‐sample t‐test, t = .56, p = .58). All participants with PSA had an ischemic (n = 15) or hemorrhagic (n = 2) stroke in the left hemisphere (lesion size: 28.85 ± 42.84 cm3).
3.2. Head movement parameters
The FD across time points (Power et al., 2012) was calculated for each participant to examine the confounding influence of head motion on dALFF and dFC. No subject exhibited head motion that exceeded 2.5 mm of translation or 2.5° of rotation. Mean FD was not significantly different between patients with PSA and HCs (p = 0.17, two‐tailed two‐sample t‐test).
3.3. Differences in dynamic ALFF
The main results reported were based on the dALFF analysis using 50 TRs (100 s) as the window length. According to two‐sample t‐test, patients with PSA showed decreased temporal ALFF variability in the pars triangularis of left inferior frontal gyrus (TRIinf), the orbital part of left inferior frontal gyrus (ORBinf), and the left middle temporal gyrus (MTG; Table 2 and Figure 1). No significant differences were seen between the PSA participants and HCs in increased dALFF. The results of the two additional window lengths (60 s and 200 s) are reported in Figure S1.
Table 2.
Regions showing abnormal dALFF volume in patients
| Region | Cluster size (voxels) | T valuea | MNI coordinates | ||
|---|---|---|---|---|---|
| x | y | z | |||
| Aphasia < HC | |||||
| L ORBinf | 24 | −3.97 | −45 | 42 | −12 |
| L TRIinf | 25 | −5.69 | −42 | 39 | 6 |
| L MTG | 27 | −4.48 | −60 | −18 | −18 |
x, y, z, coordinates of primary peak locations in the Montreal Neurological Institute (MNI) space. L, left. T value, statistical value of peak voxel showing dALFF differences between the groups. Abbreviations: MTG, middle temporal gyrus; ORBinf, inferior frontal gyrus, orbital part; TRIinf, inferior frontal gyrus, pars triangularis.
Negative value represents lower dALFF.
Figure 1.
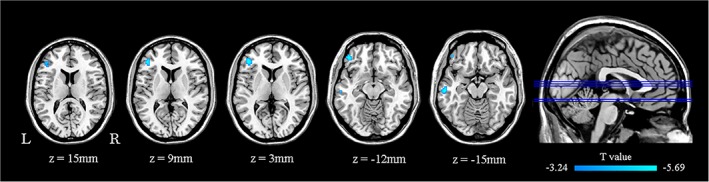
Regions showing significant differences in dALFF between PSA participants and controls. All comparisons were performed using a two‐sample t‐test (AlphaSim corrected p < .001; minimum cluster size of 19 voxels). Cold color scale indicates regions with decreased dALFF values in PSA. Numbers below each axial slice refer to the z‐plane coordinates of the MNI space, respectively. Letters L and R correspond to the left and right sides of the brain, respectively. Further details of these regions are presented in Table 2. L, left; R, right. MNI, Montreal Neurological Institute; PSA, poststroke aphasia [Color figure can be viewed at http://wileyonlinelibrary.com]
3.4. Correlation between altered dALFF and clinical characteristics
The altered dALFF in the left TRIinf in the PSA group was positively correlated with AQ (r = 0.73, p < .01; Figure 2). Other abnormal dALFF maps showed no significant correlation with the clinical aphasia performance characteristics.
Figure 2.
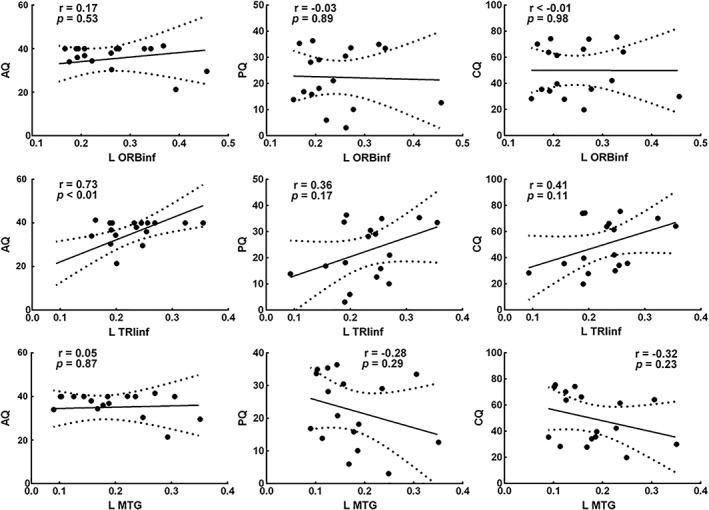
The altered dALFF value in the TRIinf was positively correlated with the AQ (r = 0.73, p < 0.01, Bonferroni corrected). The solid line and dashed lines represent the best‐fit line and 95% confidence interval of Pearson's correlation, respectively. Some data points are missing because of overlap. L, left; AQ, aphasia quotient; PQ, performance quotient; CQ, cortical quotient; MTG, middle temporal gyrus; ORBinf, inferior frontal gyrus, orbital part; TRIinf, inferior frontal gyrus, pars triangularis
3.5. Differences in dynamic FC
Significant dALFF abnormalities detected between PSA participants and HCs were selected as the seed regions for subsequent dFC analyses (Table 3 and Figure 3). For the left TRIinf seed, PSA participants showed decreased dFCs in the orbital part of left inferior frontal gyrus (ORBinf), the left medial superior frontal gyrus (SFGmed), and the left superior frontal gyrus (SFG); AlphaSim corrected p < .001 and minimum cluster size of 10 voxels). Patients with PSA also exhibited increased dFC in the right superior temporal gyrus (STG; AlphaSim corrected p < .001 and minimum cluster size of 14 voxels).
Table 3.
Regions showing abnormal dFC volume in patients
| Seed region | Connected regions | Cluster size (voxels) | T valuea | MNI coordinates | ||
|---|---|---|---|---|---|---|
| x | y | z | ||||
| L ORBinf | L MTG | 18 | −4.34 | −60 | −18 | −18 |
| R ITG | 9 | 3.72 | 39 | 0 | −33 | |
| R MTG | 10 | 3.77 | 63 | −48 | 15 | |
| L TRIinf | L SFG | 10 | −3.40 | −12 | 45 | 27 |
| L ORBinf | 13 | −4.06 | −48 | 45 | −6 | |
| L SFGmed | 19 | −4.48 | −3 | 42 | 30 | |
| R STG | 20 | 5.28 | 45 | −15 | −9 | |
| L MTG | R SFG | 7 | 3.37 | 21 | 54 | 18 |
| R MFG | 14 | 3.35 | 30 | 42 | 45 | |
| R IPG | 24 | 4.46 | 60 | −54 | 39 | |
x, y, z, coordinates of primary peak locations in the Montreal Neurological Institute (MNI) space. L, left; R, right. T value, statistical value of peak voxel showing dFC differences between the groups. Abbreviations: IPG, inferior parietal gyrus; ITG, inferior temporal gyrus; MFG, middle frontal gyrus; MTG, middle temporal gyrus; ORBinf, inferior frontal gyrus, orbital part; SFG, superior frontal gyrus; SFGmed, medial superior frontal gyrus; STG, superior temporal gyrus; TRIinf, inferior frontal gyrus, pars triangularis.
Negative value represents lower dFC; Positive value represents higher dFC.
Figure 3.
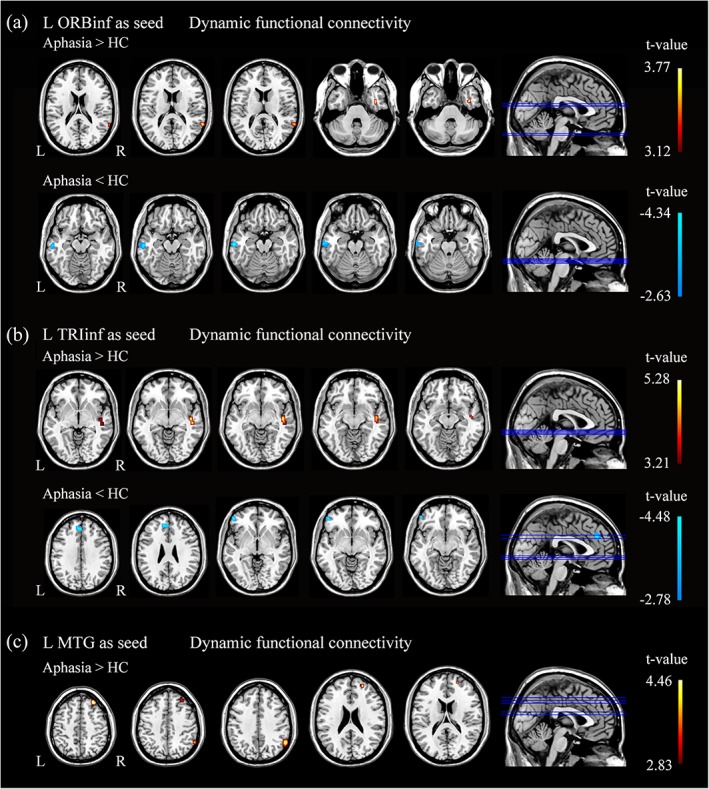
All comparisons were performed using a two‐sample t‐test. Cold color scale indicates regions with decreased dFC values in PSA. Warm color scale indicates regions with increased dFC values in PSA. Numbers below each axial slice refer to the z‐plane coordinates of the MNI space, respectively. Further details of these regions are presented in Table 3. L, left; R, right [Color figure can be viewed at http://wileyonlinelibrary.com]
For the left ORBinf seed, PSA participants showed decreased dFCs in the left MTG (AlphaSim corrected p < .001 and minimum cluster size of 13 voxels). Patients with PSA also exhibited increased dFC in the right inferior temporal gyrus (ITG) and the MTG (AlphaSim corrected p < .001 and minimum cluster size of 8 voxels).
For the left MTG seed, PSA participants showed increased dFC in the right SFG, the MFG, and the inferior parietal gyrus (IPG) (AlphaSim corrected p < .001 and minimum cluster size of 7 voxels). No significant differences were found between the PSA participants and HCs in decreased dFC.
4. DISCUSSION
This study aimed to demonstrate temporal flexibilities of network segregation and integration in PSA using whole‐brain dynamic ALFF and FC derived from rs‐fMRI data. The PSA patients exhibited diminished dynamic segregation (less temporal variability of dALFF) in the left TRIinf, ORBinf, and MTG compared with healthy subjects. Specifically, altered dALFF of the left TRIinf is positively correlated with the AQ. We also identified a general pattern of widespread language network dysfunction consisting of decreased intrahemispheric integration and increased interhemispheric integration. Our results imply that flexibility of segregation at specific regions controls global functional organization and that such dynamic patterns may be responsible for language deficits in PSA.
Our patient/control comparison revealed that PSA patients had a reduction in flexibility of activity within the left frontal and temporal subregions, indicating a disturbance in the segregation of these regions. This finding is in accordance with weaker network segregation after stroke as described by (Siegel, Ramsey, et al., 2016) linked to the pathophysiology of behavioral deficits. In healthy adults, regions within left frontal and temporal subregions tended to be stable and have a high degree of specialization in language functions (Chai et al., 2016). Duncan and Small assigned stronger network segregation as a supporting role in behavioral improvement in aphasia recovery (Duncan & Small, 2016). It has been proposed that increased brain signal flexibility reflects more efficient process, yielding more stable behavioral performance and the ability to function at a higher cognitive capacity (Garrett et al., 2013; Kielar et al., 2016). To conclude, these studies serve to demonstrate an association between more flexible functional segregation and better relevant behavioral performance, as previously demonstrated in healthy aging individuals (Chan, Park, Savalia, Petersen, & Wig, 2014). Our results as a whole showed impaired dynamic segregation in left temporo‐frontal language networks in PSA participants. Specifically, we found decreased dALFF in the left TRIinf and left ORBinf, which are referred as subregions of Broca's area (Devlin, Matthews, & Rushworth, 2003). Broca's area is classically associated with language production, and its damage results in Broca's aphasia characterized by loss of the ability to produce language (Tomasi & Volkow, 2012). With respect to the specialized operations in the language production, TRIinf is involved in semantic processing, and ORBinf contributes to syntactic processing (Hagoort, 2005; Newman, Just, Keller, Roth, & Carpenter, 2003). The different roles in language processing of the subregions of Broca's area needs a more in‐depth discovery, but our results—along with previous studies—strongly suggest a certain level of specialization in TRIinf and ORBinf. Our results indicate that pathophysiology, such as stroke, is more likely to interfere with network dynamics in specialized subregions during language production. This study may provide complementary results to previous findings wherein the diversity of static ALFF in the PSA participants was decreased mainly in the left‐lateralized fronto‐temporal language networks.
Such impaired functional specificity was also evident in the correlation analyses with clinical characteristics. Flexibility in brain organization has been linked to behaviorally advantageous changes in brain network dynamics (Cole et al., 2013; Urs et al., 2015). Our results indicate that higher flexibility of the left TRIinf activity is positively correlated with increasing AQ (decreasing severity) on the ABC in PSA patients. Given that AQ can be thought as a language measure that relies on the semantic and auditory networks (Sandberg, 2017), the results suggest that the left TRIinf plays a central role in language production and semantic processing. Although derived from local activity, segregation capacity refers to specialized processing within functional related regions, thereby reflecting the ability for specialized functional processing (Lee & Xue, 2017). The specificity of this correlation suggests that semantic processing deficit may be a consequence of reduced functional specialization of TRIinf that mediates these abilities, and decreased dynamic segregation may form putative neurophysiological explanation for the clinical aphasia severity. However, this seems counterintuitive given that the correlations were not found in the other two regions. The lack of correlations potentially resulted from the following factors: (a) the language measures used themselves; (b) the number of volumes acquired is insufficient for such a detailed analysis; (c) although the BOLD signal indirectly reflects the alterations in neural activity, it is not the optimal measure. Despite its widespread use, rs‐fMRI depending on BOLD signal contrast has several shortcomings: (a) BOLD signal relies on neurovascular coupling that is not only depend on blood oxygen levels due to neural activity, but also dependent on the changes in cerebral blood volume and cerebral blood flow relating to activation differences (Buxton, 2012); (b) the BOLD technique offers limited spatial specificity to the site of neural activity due to the contribution of draining veins to the BOLD contrast (Fox & Raichle, 2007); (c) BOLD signal alone does not provide a direct and quantitative measure of brain function during the resting state and cannot be used in isolation to derive neural metabolism metrics (Liu, 2013).
We found changes in intrahemispheric dFC showing a consistent pattern within and across networks. A notable difference in the dFC results is the loss of integration within the left TRIinf and ORBinf, which are all implicated as Broca's subregions. The decrement of Broca's area within network integration is consistent with the prevailing notion of stroke as a disorder of integration and with the theory that routine information processing in modality‐specific association cortex favors local connectivity between adjacent cortical regions (Tomasi & Volkow, 2012). With respect to the different unification operations, Broca's area is involved in different domains of language processing with a certain level of specialization in corresponding subregions (Hagoort, 2005). To flexibly integrate communication between specialized subregions, it has been considered that the human brain strikes a balance between the local segregation of function and the global integration of information (Deco et al., 2015; Lord, Stevner, Deco, & Kringelbach, 2017). Recent studies have considered that a lack of flexibility in a single brain region's activity may have consequences for the dysfunction of distributed regions. Based on the understanding that the brain functions by coordinated activity of spatially distributed regions, we could suggest that the dynamic imbalance between segregation and integration of information within the Broca's subregions may be implicated in the complex clinical aphasia deficits.
Moreover, these regions also include parts of the default mode network (DMN), showing reduction in dFC between the DMN and the fronto‐temporo‐parietal language network. This view is consistent with recent claims that these two primarily independent networks are implicated in overlapping anatomical regions and shared cognitive mechanisms (Humphreys, Paul, Maya, Binney, & Ralph, 2015). Our results, combined with the wealth of converging evidence, indicate that the DMN does not function as a monolithic entity but consists of various subregions (Muller & Meyer, 2014), whose interactions and overlap change dynamically with functionally discrete language networks. This notion would be in accordance with the observation of various cognitive deficits in nonlanguage domains in PSA. Cognitive flexibility is hypothesized to require and behaviorally relevant to strong dynamic integration of frontal systems with other network modules (Friston, 2009). To mention the critical role of Broca's area in unification of language, it is plausible that the extended language network seems to be dynamically organized around a central axis of the Broca's area, and abnormal organization of this network may partially explain the unexpected cognitive and behavioral deficits in extending local functions among stroke patients.
The reduction of dynamic segregation and integration revealed a leftward lateralization, which has been studied extensively and supports lateralization of language to the left hemisphere (Chai et al., 2016). Although lateralization has been conventionally studied in the context of individual brain regions (Pujol, et al., 1999), more recent studies have investigated the left‐lateralized large‐scale language networks as a whole (Chai et al., 2016; Gotts et al., 2013; Tomasi & Volkow, 2012). This concept might imply the optimization of neural processing involved in the complex language production that might not be efficiently performed by both hemispheres. Here, we reinforce and extend these ideas on measures of segregation and integration using whole brain dynamics of regional activity and FC in pathological states after stroke. We found (a) decreased activity within language specialized regions in ipsilesional hemisphere and (b) decreased functional connections between regions in the ipsilesional hemisphere, which offered proof for lateralization of language dynamic networks. In addition, in the end of the acute stage, disrupted integration flexibility of brain regions within language networks may be a mechanistic account of aphasia after stroke.
We also identified the upregulation of dFC in contralesional regions predominantly in the temporal, frontal, and parietal lobes. With respect to the right hemisphere, there is converging evidence for a supportive role of homologous areas to left‐lateralized language networks in language reorganization after stroke (Kiran, 2012; Turkeltaub, Messing, Norise, & Hamilton, 2011; Xing et al., 2016). In the end of acute phase, the observed enhancement of bilateral hemisphere integration might be attributed to the resolution of diaschisis, that is, intact parts of the network regain their functions (Carrera & Tononi, 2014; Feeney & Baron, 1986; Wertz, 1996), thus may enable the brain to compensate for loss of function after aphasic stroke. This assumption has received further support from fMRI studies that preserved right‐hemisphere activation and increased interhemispheric connectivity display better language function (Saur et al., 2006). Given the significant behavioral difference in PSA and HCs, the right hemisphere appears to participate in language processing in the acute stage when left hemisphere language capacities become insufficient, notwithstanding the restriction of compensatory capabilities.
The results presented here must be considered in the context of several limitations. First, the present study is limited by a combination of several factors, including a modest group size, heterogeneous stroke types, and lesion distribution. Although a very through screening of the participants was performed, we could not eliminate all the possible factors. The selection of homogeneous patients may be a big challenge, and future studies might define subgroups meeting with the criteria to draw more specific conclusion pertaining to each group. Second, a major limitation is that the seed regions identified in the dALFF analysis at the group‐level were used in the same patients to probe dynamic FC. As Individual differences in FC were heterogeneous across the cortex (Mueller et al., 2013), investigating these issues across multicenter dataset or quantifying the spatial distribution of intersubject variability using individual approach could therefore increase the robustness of our study. Third, due to the indirect characterization and limited spatial specificity of neural activity by BOLD signal, a combination of multimodal neuroimaging data, such as MEG, will make further progress. Finally, the observed dynamics may be driven by subject motion; despite our attempts to minimize this influence by applying motion‐related data exclusion and including motion regressors in the models, head motion effects cannot be completely eliminated from our analysis.
5. CONCLUSIONS
In this study, we demonstrated spatiotemporal alterations in network segregation and integration in PSA by investigating the dynamics of regional activity and connectivity. Our results revealed reductions in eloquent cortical areas activity, as well as dysfunction of intrahemispheric regions within the language‐relevant network of the ipsilesional (left) hemisphere. In addition, results suggest an enhanced interhemispheric integration in homologous areas within the unaffected hemisphere may imply compensatory capabilities in PSA. We suggested that lesion may disrupt the activity in the language network organized around the core of IFG and MTG, and abnormalities in its flexible interactions within and between networks may help explain various behavioral deficits. Our study emphasizes the importance of language networks as a spatiotemporal structure of neural activity that organizes brain dynamics. We also provide basis for a better understanding of how dysfunction in network activity may underlie clinical deficits in PSA participants.
CONFLICT OF INTEREST
The authors declare that they have no conflict of interest.
Supporting information
Supplementary Figure 1 Reproducibility results in different sliding window length. Two additional sliding‐window lengths were chosen with 30 TRs (60 s) and 100 TRs (200 s). The significant threshold was set to p < 0.001 at the voxel level, and AlphaSim correction at the cluster level to p < 0.05. Cold color scale indicates regions with decreased dALFF value in poststroke aphasia. Numbers below each axial slice refer to the z‐plane coordinates of the MNI space, respectively. L, left; R, right.
ACKNOWLEDGMENTS
The authors thank the radiologist Ying Liu (Y.L.) from the Hospital of Fuzhou for manually tracing the outline of the lesion. The authors thank three anonymous reviewers for their helpful comments on an earlier draft of this article. This work was supported by National Natural Science Foundation of China (61533006,U1808204, and 61806042), Sichuan Science and Technology Program (2018TJPT0016) and The project of the Science and Technology Department in Sichuan province (2017JY0093).
Guo J, Biswal BB, Han S, et al. Altered dynamics of brain segregation and integration in poststroke aphasia. Hum Brain Mapp. 2019;40:3398–3409. 10.1002/hbm.24605
Funding information Sichuan Science and Technology Program, Grant/Award Numbers: 2017JY0093, 2018TJPT0016; Natural Science Foundation of China, Grant/Award Numbers: 61806042, U1808204, 61533006
Contributor Information
Mi Yang, Email: 565136170@qq.com.
Huafu Chen, Email: chenhf@uestc.edu.cn.
REFERENCES
- Adhikari, M. H. , Hacker, C. D. , Siegel, J. S. , Griffa, A. , Hagmann, P. , Deco, G. , & Corbetta, M. (2017). Decreased integration and information capacity in stroke measured by whole brain models of resting state activity. Brain, 140, 1068–1085. [DOI] [PMC free article] [PubMed] [Google Scholar]
- Allen, E. A. , Damaraju, E. , Plis, S. M. , Erhardt, E. B. , Eichele, T. , & Calhoun, V. D. (2014). Tracking whole‐brain connectivity dynamics in the resting state. Cerebral Cortex, 24, 663–676. [DOI] [PMC free article] [PubMed] [Google Scholar]
- Amemiya, S. , Takao, H. , Hanaoka, S. , & Ohtomo, K. (2016). Global and structured waves of rs‐fMRI signal identified as putative propagation of spontaneous neural activity. NeuroImage, 133, 331–340. [DOI] [PubMed] [Google Scholar]
- Anand, A. , Li, Y. , Wang, Y. , Wu, J. , Gao, S. , Bukhari, L. , … Lowe, M. J. (2005). Activity and connectivity of brain mood regulating circuit in depression: A functional magnetic resonance study. Biological Psychiatry, 57, 1079–1088. [DOI] [PubMed] [Google Scholar]
- Baldassarre, A. , Metcalf, N. V. , Shulman, G. L. , & Corbetta, M. (2019). Brain networks' functional connectivity separates aphasic deficits in stroke. Neurology, 92, e125–e135. [DOI] [PMC free article] [PubMed] [Google Scholar]
- Bertolero, M. A. , Yeo, B. T. , & D'Esposito, M. (2015). The modular and integrative functional architecture of the human brain. Proceedings of the National Academy of Sciences of the United States of America, 112, E6798–E6807. [DOI] [PMC free article] [PubMed] [Google Scholar]
- Biswal, B. , Yetkin, F. Z. , Haughton, V. M. , & Hyde, J. S. (1995). Functional connectivity in the motor cortex of resting human brain using Echo‐planar Mri. Magnetic Resonance in Medicine, 34, 537–541. [DOI] [PubMed] [Google Scholar]
- Bluhm, R. , Miller, J. , Lanius, R. , Osuch, E. , Boksman, K. , Neufeld, R. , … Williamson, P. (2007). Spontaneous low‐frequency fluctuations in the BOLD signal in schizophrenic patients: Anomalies in the default network. Schizophrenia Bulletin, 33, 1004–1012. [DOI] [PMC free article] [PubMed] [Google Scholar]
- Bullmore, E. , & Sporns, O. (2009). Complex brain networks: Graph theoretical analysis of structural and functional systems. Nature Reviews. Neuroscience, 10, 186–198. [DOI] [PubMed] [Google Scholar]
- Butler, R. A. , Lambon Ralph, M. A. , & Woollams, A. M. (2014). Capturing multidimensionality in stroke aphasia: Mapping principal behavioural components to neural structures. Brain, 137, 3248–3266. [DOI] [PMC free article] [PubMed] [Google Scholar]
- Buxton, R. B. (2012). Dynamic models of BOLD contrast. NeuroImage, 62, 953–961. [DOI] [PMC free article] [PubMed] [Google Scholar]
- Buzsaki, G. , & Draguhn, A. (2004). Neuronal oscillations in cortical networks. Science, 304, 1926–1929. [DOI] [PubMed] [Google Scholar]
- Cabral, J. , Kringelbach, M. L. , & Deco, G. (2014). Exploring the network dynamics underlying brain activity during rest. Progress in Neurobiology, 114, 102–131. [DOI] [PubMed] [Google Scholar]
- Carrera, E. , & Tononi, G. (2014). Diaschisis: Past, present, future. Brain, 137, 2408–2422. [DOI] [PubMed] [Google Scholar]
- Carter, A. R. , Astafiev, S. V. , Lang, C. E. , Connor, L. T. , Rengachary, J. , Strube, M. J. , … Corbetta, M. (2010). Resting Interhemispheric functional magnetic resonance imaging connectivity predicts performance after stroke. Annals of Neurology, 67, 365–375. [DOI] [PMC free article] [PubMed] [Google Scholar]
- Chai, L. R. , Mattar, M. G. , Blank, I. A. , Fedorenko, E. , & Bassett, D. S. (2016). Functional network dynamics of the language system. Cerebral Cortex, 26, 4148–4159. [DOI] [PMC free article] [PubMed] [Google Scholar]
- Chan, M. Y. , Park, D. C. , Savalia, N. K. , Petersen, S. E. , & Wig, G. S. (2014). Decreased segregation of brain systems across the healthy adult lifespan. Proceedings of the National Academy of Sciences of the United States of America, 111, E4997–E5006. [DOI] [PMC free article] [PubMed] [Google Scholar]
- Chang, C. , & Glover, G. H. (2010). Time‐frequency dynamics of resting‐state brain connectivity measured with fMRI. NeuroImage, 50, 81–98. [DOI] [PMC free article] [PubMed] [Google Scholar]
- Chawla, D. , Lumer, E. D. , & Friston, K. J. (2000). Relating macroscopic measures of brain activity to fast, dynamic neuronal interactions. Neural Computation, 12, 2805–2821. [DOI] [PubMed] [Google Scholar]
- Chi, N. F. , Ku, H. L. , Chen, D. Y. T. , Tseng, Y. C. , Chen, C. J. , Lin, Y. C. , … Hu, C. J. (2018). Cerebral motor functional connectivity at the acute stage: An outcome predictor of ischemic stroke. Scientific Reports, 8, 16803. [DOI] [PMC free article] [PubMed] [Google Scholar]
- Christen, T. , Jahanian, H. , Ni, W. W. , Qiu, D. , Moseley, M. E. , & Zaharchuk, G. (2015). Noncontrast mapping of arterial delay and functional connectivity using resting‐state functional MRI: A study in Moyamoya patients. Journal of Magnetic Resonance Imaging, 41, 424–430. [DOI] [PMC free article] [PubMed] [Google Scholar]
- Ciric, R. , Wolf, D. H. , Power, J. D. , Roalf, D. R. , Baum, G. L. , Ruparel, K. , … Satterthwaite, T. D. (2017). Benchmarking of participant‐level confound regression strategies for the control of motion artifact in studies of functional connectivity. NeuroImage, 154, 174–187. [DOI] [PMC free article] [PubMed] [Google Scholar]
- Cole, M. W. , Reynolds, J. R. , Power, J. D. , Grega, R. , Alan, A. , & Braver, T. S. (2013). Multi‐task connectivity reveals flexible hubs for adaptive task control. Nature Neuroscience, 16, 1348–U247. [DOI] [PMC free article] [PubMed] [Google Scholar]
- Deco, G. , Tononi, G. , Boly, M. , & Kringelbach, M. L. (2015). Rethinking segregation and integration: Contributions of whole‐brain modelling. Nature Reviews. Neuroscience, 16, 430–U81. [DOI] [PubMed] [Google Scholar]
- Devlin, J. T. , Matthews, P. M. , & Rushworth, M. F. S. (2003). Semantic processing in the left inferior prefrontal cortex: A combined functional magnetic resonance imaging and transcranial magnetic stimulation study. Journal of Cognitive Neuroscience, 15, 71–84. [DOI] [PubMed] [Google Scholar]
- Doucet, G. , Naveau, M. , Petit, L. , Zago, L. , Crivello, F. , Jobard, G. , … Joliot, M. (2012). Patterns of hemodynamic low‐frequency oscillations in the brain are modulated by the nature of free thought during rest. NeuroImage, 59, 3194–3200. [DOI] [PubMed] [Google Scholar]
- Duncan, E. S. , & Small, S. L. (2016). Increased modularity of resting state networks supports improved narrative production in aphasia recovery. Brain Connectivity, 6, 524–529. [DOI] [PMC free article] [PubMed] [Google Scholar]
- Feeney, D. M. , & Baron, J. C. (1986). Diaschisis. Stroke, 17, 817–830. [DOI] [PubMed] [Google Scholar]
- Foerster, B. U. , Tomasi, D. , & Caparelli, E. C. (2010). Magnetic field shift due to mechanical vibration in functional magnetic resonance imaging. Magnetic Resonance in Medicine, 54, 1261–1267. [DOI] [PMC free article] [PubMed] [Google Scholar]
- Fox, M. D. , & Raichle, M. E. (2007). Spontaneous fluctuations in brain activity observed with functional magnetic resonance imaging. Nature Reviews. Neuroscience, 8, 700–711. [DOI] [PubMed] [Google Scholar]
- Friston, K. J. (2009). Modalities, modes, and models in functional neuroimaging. Science, 326, 399–403. [DOI] [PubMed] [Google Scholar]
- Fu, Z. N. , Tu, Y. H. , Di, X. , Du, Y. H. , Pearlson, G. D. , Turner, J. A. , … Calhoun, V. D. (2018). Characterizing dynamic amplitude of low‐frequency fluctuation and its relationship with dynamic functional connectivity: An application to schizophrenia. NeuroImage, 180, 619–631. [DOI] [PMC free article] [PubMed] [Google Scholar]
- Gao, S. R. , Chu, Y. F. , Shi, S. , Q , Peng, Y. , Dai, S. D. , & Wang, M. H. (1992). A standardization research of the aphasia battery of Chinese. Chinese Mental Health Journal, 6, 125–128. [Google Scholar]
- Garrett, D. D. , Samanez‐Larkin, G. R. , Macdonald, S. W. S. , Lindenberger, U. , Mcintosh, A. R. , & Grady, C. L. (2013). Moment‐to‐moment brain signal variability: A next frontier in human brain mapping? Neuroscience & Biobehavioral Reviews, 37, 610–624. [DOI] [PMC free article] [PubMed] [Google Scholar]
- Gotts, S. J. , Joon, J. H. , Wallace, G. L. , Saad, Z. S. , Cox, R. W. , & Alex, M. (2013). Two distinct forms of functional lateralization in the human brain. Proceedings of the National Academy of Sciences of the United States of America, 110, E3435–E3444. [DOI] [PMC free article] [PubMed] [Google Scholar]
- Grefkes, C. , & Fink, G. R. (2011). Reorganization of cerebral networks after stroke: New insights from neuroimaging with connectivity approaches. Brain, 134, 1264–1276. [DOI] [PMC free article] [PubMed] [Google Scholar]
- Greicius, M. D. , Srivastava, G. , Reiss, A. L. , & Menon, V. (2004). Default‐mode network activity distinguishes Alzheimer's disease from healthy aging: Evidence from functional MRI. Proceedings of the National Academy of Sciences of the United States of America, 101, 4637–4642. [DOI] [PMC free article] [PubMed] [Google Scholar]
- Gross, T. , & Blasius, B. (2008). Adaptive coevolutionary networks: A review. Journal of the Royal Society Interface, 5, 259–271. [DOI] [PMC free article] [PubMed] [Google Scholar]
- Guo, X. , Duan, X. , Suckling, J. , Chen, H. , & Chen, H. (2018). Partially impaired functional connectivity states between right anterior insula and default mode network in autism spectrum disorder. Human Brain Mapping, 40, 1264–1275. [DOI] [PMC free article] [PubMed] [Google Scholar]
- Hécaen, H. (1981) Aphasia and associated disorders. Taxonomy, localization and recovery: A. Kertesz, Grune and Stratton, New York, 1979, 350 pp. $32.50.
- Hagoort, P. (2005). On Broca, brain, and binding: A new framework. Trends in Cognitive Sciences, 9, 416–423. [DOI] [PubMed] [Google Scholar]
- Honey, C. J. , Kotter, R. , Breakspear, M. , & Sporns, O. (2007). Network structure of cerebral cortex shapes functional connectivity on multiple time scales. Proceedings of the National Academy of Sciences of the United States of America, 104, 10240–10245. [DOI] [PMC free article] [PubMed] [Google Scholar]
- Honey, C. J. , & Sporns, O. (2008). Dynamical consequences of lesions in cortical networks. Human Brain Mapping, 29, 802–809. [DOI] [PMC free article] [PubMed] [Google Scholar]
- Humphreys, G.F. , Paul, H. , Maya, V. , Binney, R.J. , Ralph, M.A. , Lambon. (2015) Establishing task‐ and modality‐dependent dissociations between the semantic and default mode networks. Proceedings of the National Academy of Sciences of the United States of America, 112:7857–7862. [DOI] [PMC free article] [PubMed] [Google Scholar]
- Jahanian, H. , Christen, T. , Moseley, M. E. , & Zaharchuk, G. (2018). Erroneous resting‐state fMRI connectivity maps due to prolonged arterial arrival time and how to fix them. Brain Connectivity, 8, 362–370. [DOI] [PMC free article] [PubMed] [Google Scholar]
- Kielar, A. , Deschamps, T. , Chu, R. K. , Jokel, R. , Khatamian, Y. B. , Chen, J. J. , & Meltzer, J. A. (2016). Identifying dysfunctional cortex: Dissociable effects of stroke and aging on resting state dynamics in MEG and fMRI. Frontiers in Aging Neuroscience, 8, 40. [DOI] [PMC free article] [PubMed] [Google Scholar]
- Kim, H. , & Na, D. L. (2004). Normative data on the Korean version of the Western aphasia battery. Journal of Clinical and Experimental Neuropsychology, 26, 1011–1020. [DOI] [PubMed] [Google Scholar]
- Kiran, S. (2012). What is the nature of Poststroke language recovery and reorganization? ISRN Neurology, 2012, 786872. [DOI] [PMC free article] [PubMed] [Google Scholar]
- Klingbeil, J. , Wawrzyniak, M. , Stockert, A. , & Saur, D. (2019). Resting‐state functional connectivity: An emerging method for the study of language networks in post‐stroke aphasia. Brain and Cognition, 131, 22–33. [DOI] [PubMed] [Google Scholar]
- Lee, T. W. , & Xue, S. W. (2017). Linking graph features of anatomical architecture to regional brain activity: A multi‐modal MRI study. Neuroscience Letters, 651, 123–127. [DOI] [PubMed] [Google Scholar]
- Li, J. , Duan, X. , Cui, Q. , Chen, H. , & Liao, W. (2019). More than just statics: Temporal dynamics of intrinsic brain activity predicts the suicidal ideation in depressed patients. Psychological Medicine, 49, 852–860. [DOI] [PubMed] [Google Scholar]
- Liao, W. , Li, J. , Ji, G. J. , Wu, G. R. , Long, Z. , Xu, Q. , … Chen, H. (2019). Endless fluctuations: Temporal dynamics of the amplitude of low frequency fluctuations. IEEE Transactions on Medical Imaging. In press. DOI: 10.1109/TMI.2019.2904555. [DOI] [PubMed] [Google Scholar]
- Liao, W. , Wu, G. R. , Xu, Q. , Ji, G. J. , Zhang, Z. , Zang, Y. F. , & Lu, G. (2014). DynamicBC: A MATLAB toolbox for dynamic brain connectome analysis. Brain Connectivity, 4, 780–790. [DOI] [PMC free article] [PubMed] [Google Scholar]
- Liao, W. , Zhang, Z. , Mantini, D. , Xu, Q. , Ji, G. J. , Zhang, H. , … Lu, G. (2014). Dynamical intrinsic functional architecture of the brain during absence seizures. Brain Structure & Function, 219, 2001–2015. [DOI] [PubMed] [Google Scholar]
- Liu, T. T. (2013). Neurovascular factors in resting‐state functional MRI. NeuroImage, 80, 339–348. [DOI] [PMC free article] [PubMed] [Google Scholar]
- Lord, L. D. , Stevner, A. B. , Deco, G. , & Kringelbach, M. L. (2017). Understanding principles of integration and segregation using whole‐brain computational connectomics: Implications for neuropsychiatric disorders. Philosophical Transactions, 375, 20160283. [DOI] [PMC free article] [PubMed] [Google Scholar]
- Lv, Y. T. , Margulies, D. S. , Craddock, R. C. , Long, X. Y. , Winter, B. , Gierhake, D. , … Villringer, A. (2013). Identifying the perfusion deficit in acute stroke with resting‐state functional magnetic resonance imaging. Annals of Neurology, 73, 136–139. [DOI] [PubMed] [Google Scholar]
- Ma, S. , Calhoun, V. D. , Phlypo, R. , & Adali, T. (2014). Dynamic changes of spatial functional network connectivity in healthy individuals and schizophrenia patients using independent vector analysis. NeuroImage, 90, 196–206. [DOI] [PMC free article] [PubMed] [Google Scholar]
- Matsui, T. , Murakami, T. , & Ohki, K. (2016). Transient neuronal coactivations embedded in globally propagating waves underlie resting‐state functional connectivity. Proceedings of the National Academy of Sciences of the United States of America, 113, 6556–6561. [DOI] [PMC free article] [PubMed] [Google Scholar]
- Mueller, S. , Wang, D. H. , Fox, M. D. , Yeo, B. T. T. , Sepulcre, J. , Sabuncu, M. R. , … Liu, H. S. (2013). Individual variability in functional connectivity architecture of the human brain. Neuron, 77, 586–595. [DOI] [PMC free article] [PubMed] [Google Scholar]
- Muller, A. M. , & Meyer, M. (2014). Language in the brain at rest: New insights from resting state data and graph theoretical analysis. Frontiers in Human Neuroscience, 8, 228. [DOI] [PMC free article] [PubMed] [Google Scholar]
- Newman, S. D. , Just, M. A. , Keller, T. A. , Roth, J. , & Carpenter, P. A. (2003). Differential effects of syntactic and semantic processing on the subregions of Broca's area. Cognitive Brain Research, 16, 297–307. [DOI] [PubMed] [Google Scholar]
- Pessoa, L. , Gutierrez, E. , Bandettini, P. , & Ungerleider, L. (2002). Neural correlates of visual working memory: fMRI amplitude predicts task performance. Neuron, 35, 975–987. [DOI] [PubMed] [Google Scholar]
- Power, J. D. , Barnes, K. A. , Snyder, A. Z. , Schlaggar, B. L. , & Petersen, S. E. (2012). Spurious but systematic correlations in functional connectivity MRI networks arise from subject motion. NeuroImage, 59, 2142–2154. [DOI] [PMC free article] [PubMed] [Google Scholar]
- Pujol, J. , Deus, J. , Jm , & Capdevila, A. (1999). Cerebral lateralization of language in normal left‐handed people studied by functional MRI. Neurology, 52, 1038. [DOI] [PubMed] [Google Scholar]
- Rees, D. , Backus, B. T. , & Heeger, D. J. (2000). Activity in primary visual cortex predicts performance in a visual detection task. Nature Neuroscience, 3, 940–945. [DOI] [PubMed] [Google Scholar]
- Rubinov, M. , & Sporns, O. (2010). Complex network measures of brain connectivity: Uses and interpretations. NeuroImage, 52, 1059–1069. [DOI] [PubMed] [Google Scholar]
- Sandberg, C.,. W. (2017). Hypoconnectivity of resting‐state networks in persons with aphasia compared with healthy age‐matched adults. Frontiers in Human Neuroscience, 11, 91. [DOI] [PMC free article] [PubMed] [Google Scholar]
- Saur, D. , Lange, R. , Baumgaertner, A. , Schraknepper, V. , Willmes, K. , Rijntjes, M. , & Weiller, C. (2006). Dynamics of language reorganization after stroke. Brain, 129, 1371–1384. [DOI] [PubMed] [Google Scholar]
- Siegel, J. S. , Ramsey, L. E. , Snyder, A. Z. , Metcalf, N. V. , Chacko, R. V. , Weinberger, K. , … Corbetta, M. (2016). Disruptions of network connectivity predict impairment in multiple behavioral domains after stroke. Proceedings of the National Academy of Sciences of the United States of America, 113, E4367–E4376. [DOI] [PMC free article] [PubMed] [Google Scholar]
- Siegel, J. S. , Snyder, A. Z. , Ramsey, L. , Shulman, G. L. , & Corbetta, M. (2016). The effects of hemodynamic lag on functional connectivity and behavior after stroke. Journal of Cerebral Blood Flow and Metabolism, 36, 2162–2176. [DOI] [PMC free article] [PubMed] [Google Scholar]
- Tomasi, D. , & Volkow, N. D. (2012). Resting functional connectivity of language networks: Characterization and reproducibility. Molecular Psychiatry, 17, 841–854. [DOI] [PMC free article] [PubMed] [Google Scholar]
- Turkeltaub, P. E. , Messing, S. , Norise, C. , & Hamilton, R. H. (2011). Are networks for residual language function and recovery consistent across aphasic patients? Neurology, 76, 1726–1734. [DOI] [PMC free article] [PubMed] [Google Scholar]
- Urs, B. , Axel, S. F. , Henrik, W. , Susanne, E. , Nina, R. S. , Leila, H. , … Heike, T. (2015). Dynamic reconfiguration of frontal brain networks during executive cognition in humans. Proceedings of the National Academy of Sciences of the United States of America, 112, 11678–11683. [DOI] [PMC free article] [PubMed] [Google Scholar]
- van Hees, S. , McMahon, K. , Angwin, A. , de Zubicaray, G. , Read, S. , & Copland, D. A. (2014). A functional MRI study of the relationship between naming treatment outcomes and resting state functional connectivity in post‐stroke aphasia. Human Brain Mapping, 35, 3919–3931. [DOI] [PMC free article] [PubMed] [Google Scholar]
- Wagner, A. D. , Schacter, D. L. , Rotte, M. , Koutstaal, W. , Maril, A. , Dale, A. M. , … Buckner, R. L. (1998). Building memories: Remembering and forgetting of verbal experiences as predicted by brain activity. Science, 281, 1188–1191. [DOI] [PubMed] [Google Scholar]
- Wei, L. , Jiao, L. , Duan, X. , Qian, C. , Chen, H. , & Chen, H. (2018). Static and dynamic connectomics differentiate between depressed patients with and without suicidal ideation. Human Brain Mapping, 39, 4105–4118. [DOI] [PMC free article] [PubMed] [Google Scholar]
- Wertz, R. T. (1996). Aphasia in acute stroke: Incidence, determinants, and recovery. Annals of Neurology, 40, 129–130. [DOI] [PubMed] [Google Scholar]
- Xing, S. , Lacey, E. H. , Skipperkallal, L. M. , Jiang, X. , Harrislove, M. L. , Zeng, J. , & Turkeltaub, P. E. (2016). Right hemisphere grey matter structure and language outcomes in chronic left hemisphere stroke. Brain, 139, 227–241. [DOI] [PMC free article] [PubMed] [Google Scholar]
- Yan, C. G. , Cheung, B. , Kelly, C. , Colcombe, S. , Craddock, R. C. , Di Martino, A. , … Milham, M. P. (2013). A comprehensive assessment of regional variation in the impact of head micromovements on functional connectomics. NeuroImage, 76, 183–201. [DOI] [PMC free article] [PubMed] [Google Scholar]
- Yang, M. , Li, J. , Li, Y. B. , Li, R. , Pang, Y. J. , Yao, D. Z. , … Chen, H. F. (2016). Altered intrinsic regional activity and interregional functional connectivity in post‐stroke aphasia. Scientific Reports, 6, 24803. [DOI] [PMC free article] [PubMed] [Google Scholar]
- Yang, M. , Yang, P. , Fan, Y. S. , Li, J. , Yao, D. , Liao, W. , & Chen, H. (2018). Altered structure and intrinsic functional connectivity in post‐stroke aphasia. Brain Topography, 31, 300–310. [DOI] [PubMed] [Google Scholar]
- Yu, Z. Z. , Jiang, S. J. , Bi, S. , Li, J. , Lei, D. , & Sun, L. L. (2013). Relationship between linguistic functions and cognitive functions in a clinical study of Chinese patients with post‐stroke aphasia. Chinese Medical Journal, 126, 1252–1256. [PubMed] [Google Scholar]
Associated Data
This section collects any data citations, data availability statements, or supplementary materials included in this article.
Supplementary Materials
Supplementary Figure 1 Reproducibility results in different sliding window length. Two additional sliding‐window lengths were chosen with 30 TRs (60 s) and 100 TRs (200 s). The significant threshold was set to p < 0.001 at the voxel level, and AlphaSim correction at the cluster level to p < 0.05. Cold color scale indicates regions with decreased dALFF value in poststroke aphasia. Numbers below each axial slice refer to the z‐plane coordinates of the MNI space, respectively. L, left; R, right.