
Figure 5.
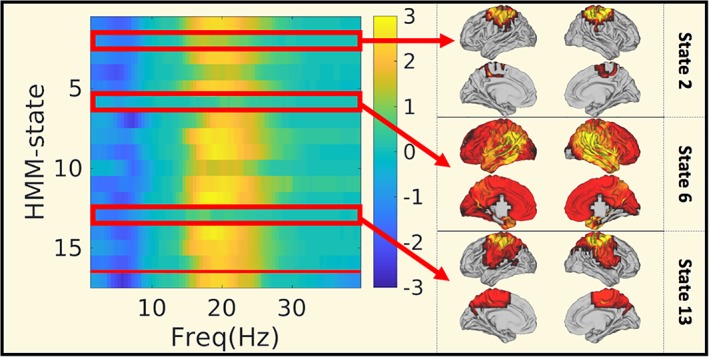
BZD induced changes in the static and HMM‐specific frequency content. Comparison of static and HMM frequency content averaged across parcels between the MS(BZD+) and the MS(BZD−) cohort. The colour indicates ‐log10 of the p‐value, with values ranging from 1.3 (p = .05) to 3 (p = .001). The sign of the p‐value indicates the direction: Blue: Less power in MS(BZD+), yellow: More power in MS(BZD+). On the y‐axis we have plotted the 16 HMM states and the static result (at y = 17). MS, multiple sclerosis; HMM, hidden Markov model; BZD, benzodiazepine [Color figure can be viewed at http://wileyonlinelibrary.com]