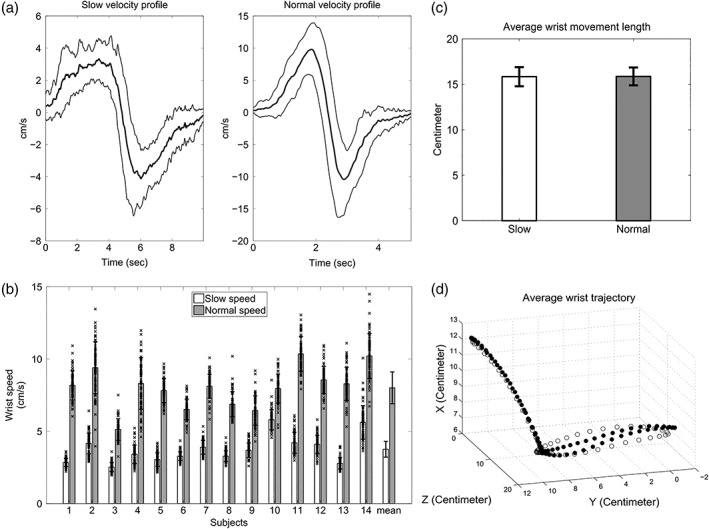
Figure 2.

(a) Example average velocity profile (S03). Each average velocity profile (thick curves) was obtained by averaging over the individual slow or normal velocities (64 trials per velocity type). Thin curves depict the corresponding standard deviations. (b) Average wrist speed. The first 14 grouped bars show the average wrist speed for individual subjects and for slow (white bars) and normal (gray bars) movements separately. Error bars depict the corresponding standard deviations. The last grouped bars show the average wrist speeds calculated for each movement type over all subjects and sessions. The crosses depict the average wrist speeds of individual trials and show naturally occurring trial‐by‐trial variations. (c) Average wrist movement length. The bars illustrate the mean length of wrist movements averaged over all subjects for slow and normal speeds separately. Standard deviations are shown by error bars. (d) Wrist movement trajectory. The white and black circles depict the average wrist trajectories (over all trials/subjects) for normal and slow speeds, respectively
