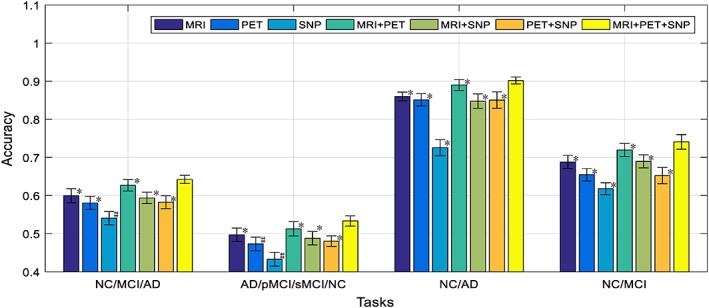
Figure 8.

Comparison of classification accuracy of the proposed framework by using different modalities (i.e., MR, PET, and SNP) and modality combinations (i.e., MRI + PET, MRI + SNP, PET+SNP, MRI + PET+SNP) for four different classification tasks (where * denotes the Friedman test with p < .0001 and # denotes the Friedman test with p < .00001) [Color figure can be viewed at http://wileyonlinelibrary.com]
