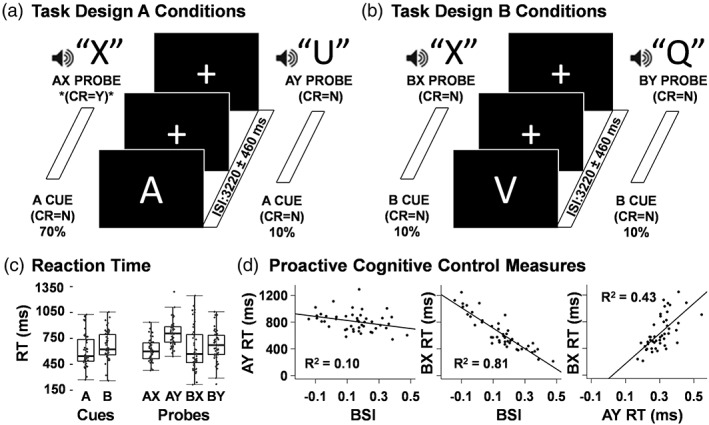
Figure 1.

Diagrammatic representation of task and behavioral results. The required correct response (CR) was “yes” (Y) when the letter X followed the letter A (target sequence AX; denoted with an asterisk; 70% of trials; panel a left). The three remaining conditions (AY, panel a right; BX and BY, panel b) all require a “no” (N) response to both cue and probe and each occurred on 10% of trials. The inter‐stimulus interval (ISI) was 3,220 ms jittered by one TR (2760–3,680 ms). The inter‐block interval was 4,520 ms and also jittered by one TR (4060–4,980 ms). Box‐and‐whisker plots depict reaction times (RT) for all task conditions (panel c). Scatter plots (panel d) depict the relationships between behavioral measures of proactive and reactive cognitive control (BSI = behavioral shift index, AY RT, and BX RT)
