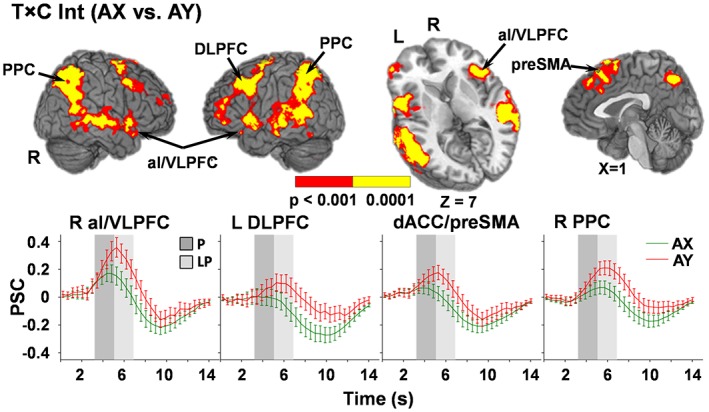
Figure 3.

Regions exhibiting a significant interaction between time (T) and condition (C) for AX relative to AY trials (p < .001: red; p < .0001: yellow). Locations of the sagittal (X) and axial (Z) slices are given according to the Talairach atlas for the left (L) and right (R) hemispheres. Percent signal change (PSC) extracted across each region are plotted over the entire hemodynamic response function (HRF) for AY (red) and AX (green) probe conditions, with error bars reflecting the standard error across participants. Shaded bars indicate peak (P; dark gray) and late peak (LP; light gray) phases of HRF. Selected regions include left and right posterior parietal cortex (PPC; Center of Mass: left, −41.3, −54.7, 40.9; right, 42.8, −58.8, 39.8), anterior insular/ventrolateral prefrontal cortex (aI/VLPFC; Center of Mass: left, −46.8, 8.0, 0.8; right, 47.9, 14.1, −1.8), dorsolateral prefrontal cortex (DLPFC; Center of Mass: left, −45.3, 10.9, 35.9; right, 42.2, 14.1, 39.2), dorsal anterior cingulate cortex/pre‐supplementary motor cortex (dACC/preSMA; Center of Mass: 2.1, 20.4, 47.7)
