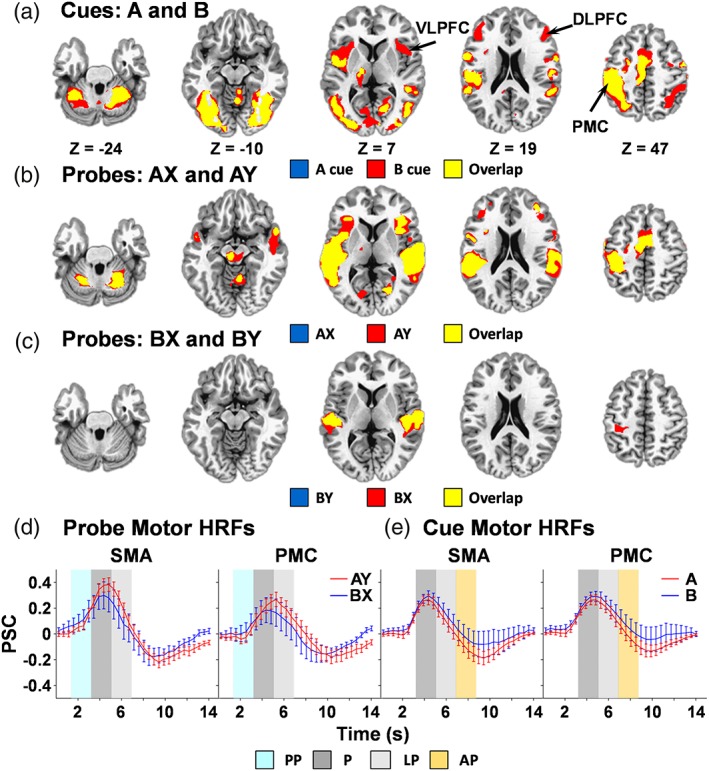
Figure 6.

Overlay plots depicting activation for cue conditions (panel a), a probe conditions (AX and AY, panel b), B probe conditions (BX and BY, panel c) relative to baseline. Highlighted regions include anterior insula/ventrolateral prefrontal cortex (VLPFC), dorsolateral prefrontal cortex (DLPFC), and primary motor cortex (PMC). Locations of the axial (Z) slices are given according to the Talairach atlas for the left (L) and right (R) hemispheres. Percent signal change (PSC) data are plotted over the entire hemodynamic response function (HRF) for the supplementary motor area (SMA) and PMC regions of interest for probes (panel d) and cues (panel e), with error bars reflecting the standard error across participants. Shaded regions of the HRF indicate pre‐peak (PP; cyan), peak (P; dark gray), late peak (LP; light gray), and after‐peak (AP; orange) phases
