
Figure 1.
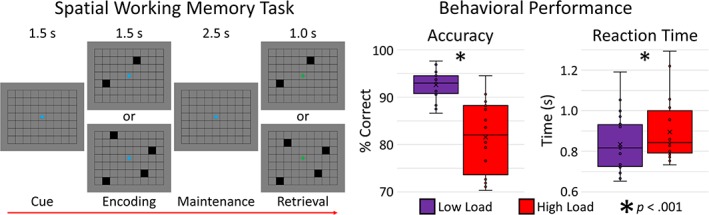
Left panel: Load‐varying spatial working memory (SWM) task. Right panel: Behavioral results for the SWM task with accuracy (% correct) depicted to the left, and reaction time (s) to the right. Performance differed between loads, such that participants were more accurate and faster to respond during low‐load (purple) relative to high‐load (red) performance (p < .001) [Color figure can be viewed at http://wileyonlinelibrary.com]