
Figure 3.
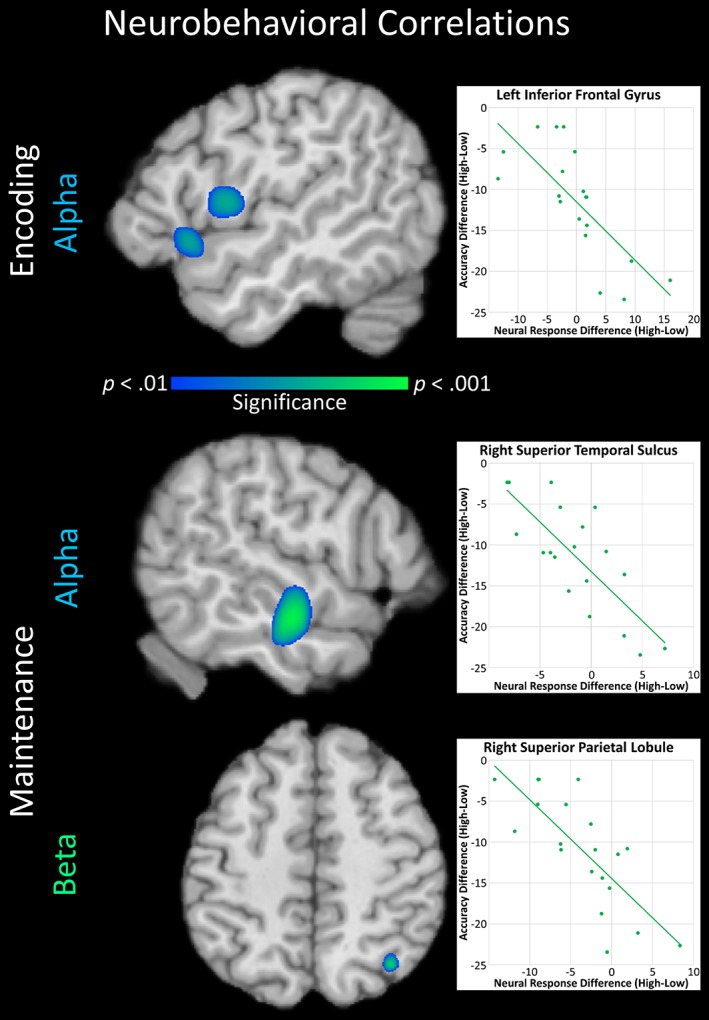
Top: Load‐related differences (high–low) in alpha (8–11 Hz) activity in two regions of the left inferior frontal gyrus (IFG) during encoding were negatively correlated with load‐related differences in accuracy. A scatterplot representing the relationship is presented to the right utilizing the data from the peak voxel of the posterior IFG cluster. The scatterplot of the anterior IFG cluster was very similar. Values on the x‐axis represent the difference between the magnitudes of the response (expressed in pseudo‐t units) during the high‐load relative to low‐load condition. Specifically, a negative value denotes a stronger decrease in alpha activity during the high‐ relative to low‐load condition, while a positive value denotes a stronger decrease in alpha activity during the low‐ relative to high‐load condition. Values on the y‐axis represent the difference between the percentages of correct trials (high – low condition). Specifically, a negative value denotes lower accuracy in the high‐ relative to low‐load condition. The relationship between activity in these two IFG clusters and accuracy persisted throughout maintenance (not pictured). Bottom: Load‐related differences in alpha activity in the right superior temporal sulcus and load‐related differences in beta (15–20 Hz) activity in the right superior parietal lobule during maintenance were negatively correlated with load‐related differences in accuracy. Scatterplots representing these relationships are presented to the right utilizing the data from the peak voxels of the whole‐brain correlation maps, and the axis values should be interpreted in the same manner as that described above. All maps are shown at a threshold of p < .01, cluster‐corrected [Color figure can be viewed at http://wileyonlinelibrary.com]