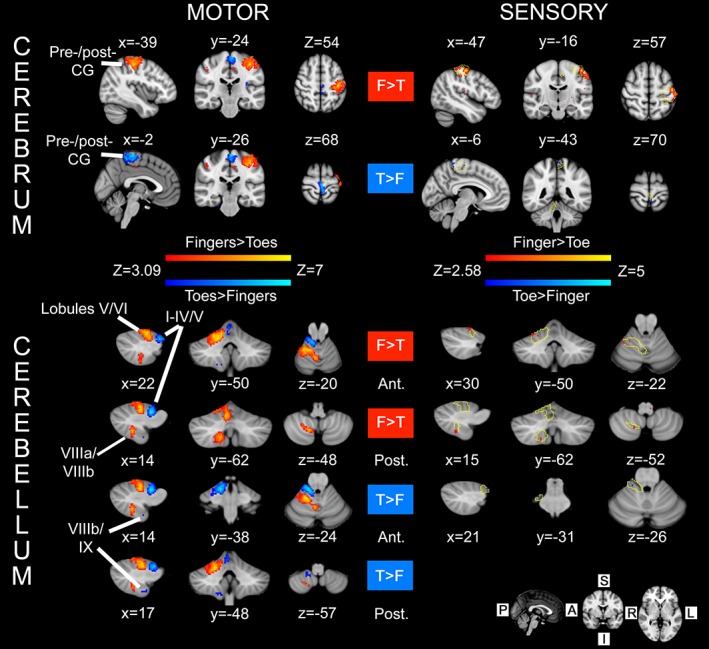
Figure 1.

Sensorimotor integration in the cerebrum and cerebellum (N = 20). For both tasks (motor and sensory), the contrast between hand/finger > foot/toe is shown in red‐yellow colours, and foot/toe > hand/finger is shown in blue‐light blue colours. ‘Motor’: activity within the cerebrum and cerebellum in response to an externally paced movement task. Statistical maps reflect differences in activity in response to movement of the right hand and right foot (performed separately). ‘Sensory’: results of vibrotactile stimulation at 150 Hz of the right index finger and large toe on the right foot with MRI‐compatible piezoelectric tactile stimulators. Activity is shown overlaid on top of the corresponding motor maps (yellow outline). Convergence of sensorimotor input/output is found at the levels of the cerebrum (postcentral gyrus) and cerebellum (toes = Lobules I–IV and fingers = Lobule V). The anatomical level of each section is shown in Montreal Neurological Institute (MNI) coordinates (in mm) beside each image, corresponding to the location of the voxel with highest Z‐value for that contrast [see contrast labels: RED for finger(s) > toe(s), = ‘F > T’; BLUE for toe(s) > finger(s) = ‘T > F’]. Labels anterior/posterior: the listed coordinates refer to activity within anterior/posterior cerebellar lobes, respectively. Motor activity was assessed with cluster forming threshold Z > 3.09 and cluster corrected significance p < .05. Activity in response to vibrotactile stimulation for the cerebellum was obtained with an uncorrected significance threshold of p < .005 [Color figure can be viewed at http://wileyonlinelibrary.com]
