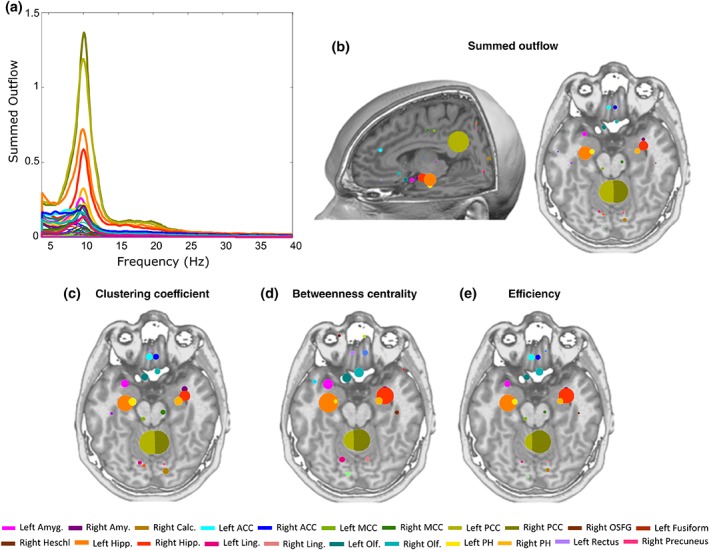
Figure 1.

Network topology results. (a) Summed outflow across frequencies (4–40 Hz) for all 82 ROIs. (b) Alpha‐band statistically significant increases in summed outflow (spheres) relative to surrogate data obtained from phase‐shuffling of the original data. The size of the sphere reflects summed outflow. (c) Alpha‐band significant clustering coefficient (spheres). (d) Alpha‐band significant betweenness centrality (spheres). (e) Alpha‐band significant efficiency (spheres). The bigger the sphere, the higher the topology value in that region [Color figure can be viewed at http://wileyonlinelibrary.com]
