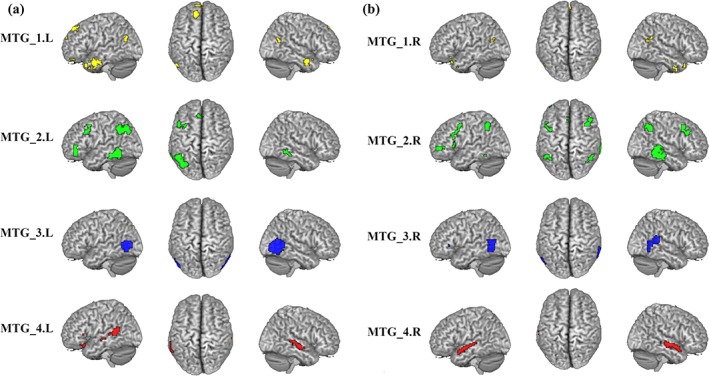
Figure 5.

The specific functional patterns for the middle temporal gyrus (MTG) subregion. The brain areas show significantly more correlated and coupled with a given subregion than with any of the other MTG subregions [Color figure can be viewed at http://wileyonlinelibrary.com]
