
Figure 6.
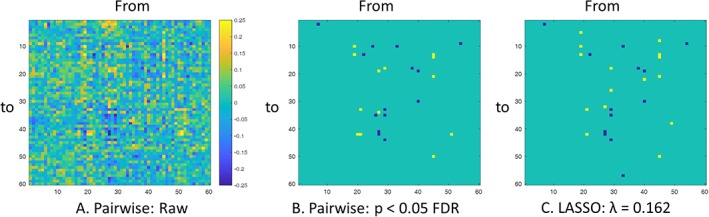
(a) Pairwise matrix of interregional causal influence of metabolic activity. The columns represent influencing independent components (ICs), while the rows represent influenced ICs. (b) Ternary matrix of significant positive or negative interregional causal influences thresholded at p < .05 after false discovery rate (FDR) correction. (c) Ternary matrix of positive or negative interregional causal influences identified at λ = 0.162 using least absolute shrinkage and selection operator (LASSO) regression [Color figure can be viewed at http://wileyonlinelibrary.com]