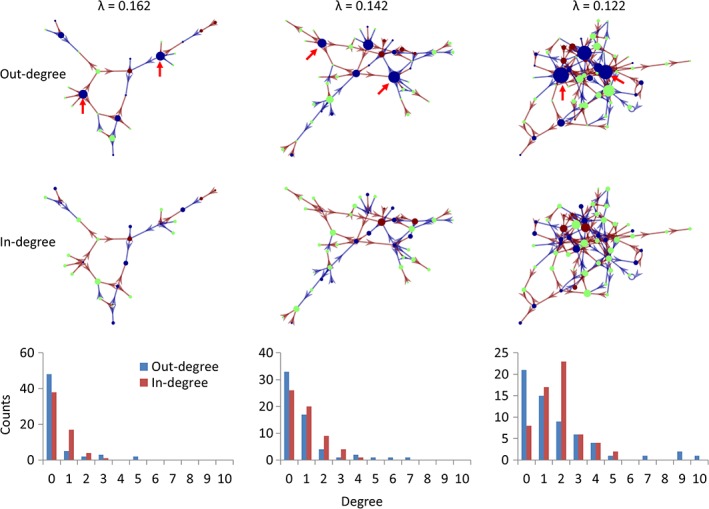
Figure 8.

The giant component of the causal interregional influencing network of metabolic activity at different λ levels with the sizes of the nodes reflecting out‐degree (top row) and in‐degree (middle row). The bottom row shows the degree distributions of the whole influencing network at the three λ levels. Brown and blue arrows indicate positive and negative influences identified using least absolute shrinkage and selection operator (LASSO) regression. Blue, green, and brown regions indicate positive, none, and negative age effects on regional metabolic activity. The red arrows highlight the two influencing nods at different λ levels [Color figure can be viewed at http://wileyonlinelibrary.com]
