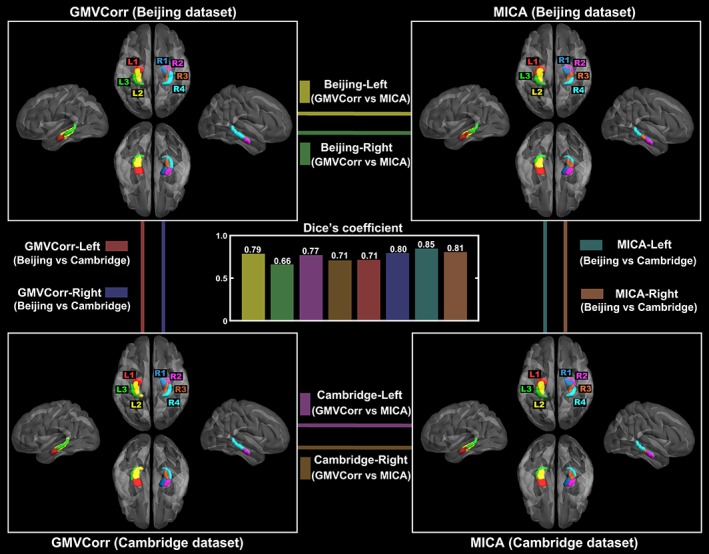
Figure 3.

Gray matter volume correlation (GMVCorr) and masked independent component analysis (MICA)‐based parcellation schemes for the two data sets. Dice's coefficients between different parcellation methods (GMVCorr vs. MICA, within each data set) and different data sets (Beijing vs. Cambridge, within each method) are shown in the central panel, with an average value of 0.76. The parcellation results (NIFTI format) are provided in the have been released on the neuroimaging informatics tools and resources clearinghouse (NITRC) website (https://www.nitrc.org/projects/hippo_gmvc/) [Color figure can be viewed at http://wileyonlinelibrary.com]
