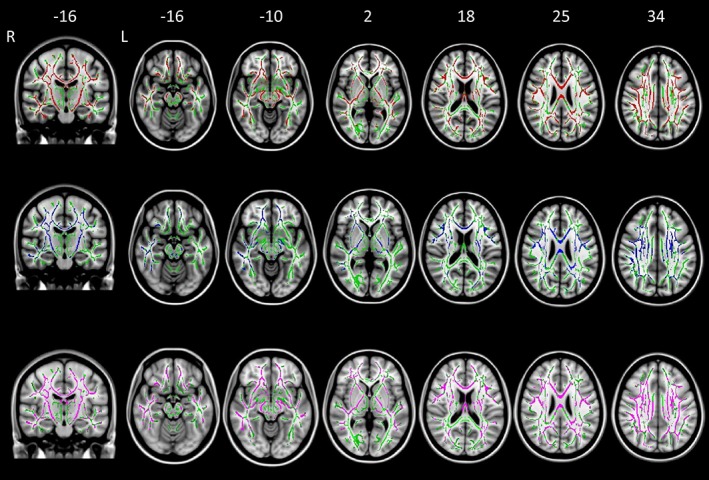
Figure 1.

TBSS results of comparison between classic ALS patients and healthy controls. Axial and coronal T1‐weighted images of the Montreal Neurologic Institute standard brain show tract‐based spatial statistics (TBSS) results in patients with classic ALS compared with healthy control subjects. Voxel‐wise group differences in fractional anisotropy (red), mean diffusivity (blue), and radial diffusivity (purple) are shown. Results were overlaid on white‐matter skeleton images (green; p < .05, corrected for multiple comparisons). Abbreviations. ALS: amyotrophic lateral sclerosis; L: left; R: right [Color figure can be viewed at http://wileyonlinelibrary.com]
