
Figure 1.
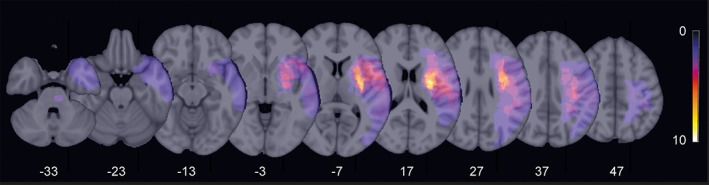
Stroke lesion overlay. Stroke lesions were projected to the left hemisphere for each patient and overlaid onto a T1 template in MNI standard space. Color indicates the number of patients with stroke lesions in the corresponding voxel. Z values mark the MNI coordinates of the transverse section