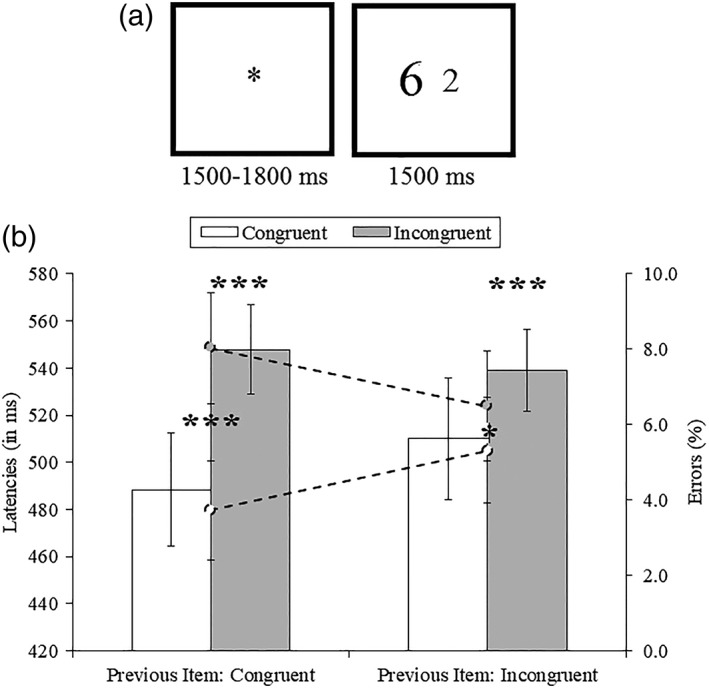
Figure 1.

Experimental procedure and behavioral results. (a) Sequence of events within a trial. (b) Mean solution times (columns) and percentages of errors (dashed lines) for current congruent and incongruent trials, as a function of previous congruent or incongruent trials. Errors bars represent the standard error of the mean (S.E.M.) *p < .05, **p < .01, ***p < .001. Upper stars refer to analyses on solution times and lower stars refer to analyses on percentages of errors
