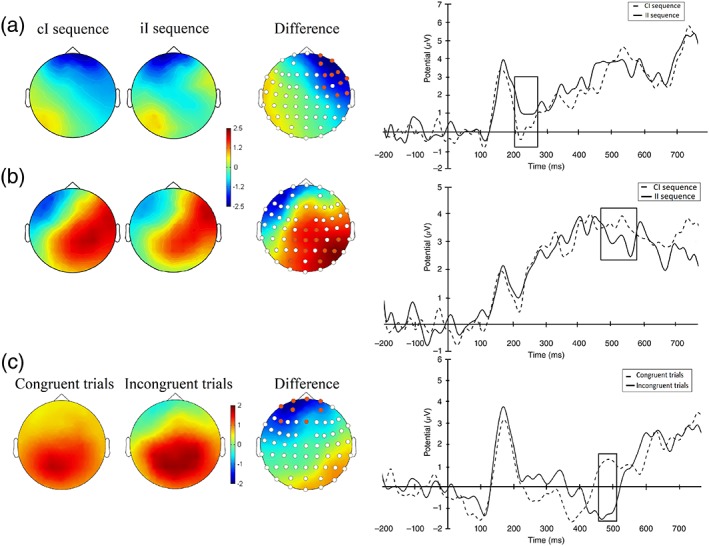
Figure 2.

Cluster‐based permutation tests were conducted to analyze the ERPs associated with the conflict adaptation effect. (a) Left, scalp distribution of cI and iI trials during the significant cluster (208–232 ms), revealing larger frontal negativity for cI trials than iI trials. Right, wave amplitudes from the significant cluster (Fp2, F4, F8, T8, AF4, FC4, F6, C6, AF8, FT8, and FT10) for cI (dashed line), and iI trials (black line), displaying the N200 component (black box). (b) Left, scalp distribution of cI and iI trials during the significant cluster (532–568 ms), revealing larger right‐lateralized positivity for cI trials than iI trials. Right, wave amplitudes from the significant cluster (P4, Cz, Pz, CP1, CP2, CP6, C2, PO3, PO4, P6, and CPz) for cI (dashed line), and iI trials (black line), displaying the conflict SP component (black box). (c) Left, scalp distribution for congruent and incongruent trials during the significant cluster (460–508 ms), revealing larger frontal negativity for incongruent trials than congruent trials. Right, Wave amplitudes from the significant cluster (Fp1, Fp2, AF4, AF7, Fpz, Fz, FT9, AF3, and F5) for congruent (dashed line), and incongruent trials (black line), displaying the N450 component (black box) [Color figure can be viewed at https://wileyonlinelibrary.com]
