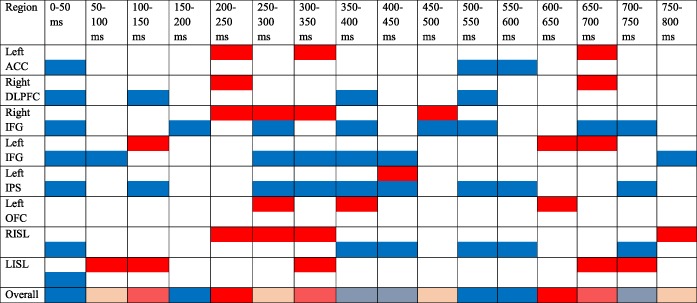
Table 6.
Specification of the time course of activation within the cognitive control network. EEG source analyses used the eight ROIs defined for the DCM model. Results of Time (50 ms windows) × ROIs × Trial type (cI trials, iI trials) repeated measure anova for left anterior cingulate cortex, right dorsolateral prefrontal cortex, right inferior frontal gyrus, left inferior frontal gyrus, left intraparietal sulcus, left orbitofrontal cortex, right anterior insula, and left anterior insula are displayed [Color table can be viewed at https://wileyonlinelibrary.com]

|
ACC = anterior cingulate cortex; DLPFC = dorsolateral prefrontal cortex; LIFG = left inferior frontal gyrus; LIPS = left intraparietal sulcus; LISL = left anterior insula; LOFC = left orbitofrontal cortex; RIFG = right inferior frontal gyrus; ROI: regions of interest; RISL = right anterior insula. Plotted are significant activations from stimulus onset to 800 ms. Red corresponds to significantly larger activations for cI trials than for iI trials. Blue corresponds to significantly larger activations for iI trials than for cI trials. The last line represents the overall activation for every ROIs. Only activations that survived the FDR correction for multiple comparisons are displayed.
