
Figure 1.
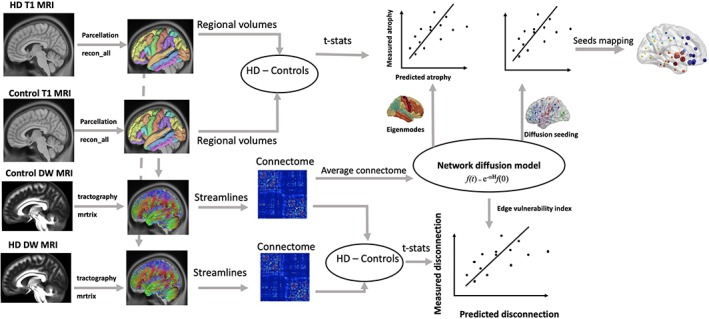
A flow diagram for the data analysis process used in the study. T1‐weighted structural MRI data from healthy controls (N = 26) and HD (N = 26) were parcellated into 82 brain regions using FreeSurfer reconall protocol. Atrophy in these regions were estimated by calculating the t‐statistics of the difference between HD and controls. Diffusion weighted MRI data from healthy controls and HD were used to generate streamlines using constrained spherical deconvolution (CSD) based tractography available in the MRtrix software. The number of streamlines and brain parcels (from FreeSurfer analysis) were combined to obtain connectome matrix, which represented total number of streamlines (edges) connecting each of the brain regions (nodes). The connectomes from healthy controls were averaged to obtain a healthy connectome matrix, which was used to model network diffusion. In the first analysis, eigenvectors of healthy connectome graph Laplacian were identified as eigenmodes of diffusion. The first five eigenmodes were statistically compared against measured atrophy (t‐statistics) using correlation analysis. In the second analysis, network diffusion was run on the healthy connectome by repeatedly initiating diffusion from each regions of the brain. Predicted degeneration for each seed region were statistically compared against measured degeneration. In the third analysis, a measure of predicted disconnection, which was calculated as total diffusion in the corresponding nodes, was estimated for network diffusion from each seed region in the brain. The predicted disconnection was statistically compared against measured disconnection (t‐statistics of the difference in number of streamlines between HD and controls) [Color figure can be viewed at http://wileyonlinelibrary.com]