
Figure 3.
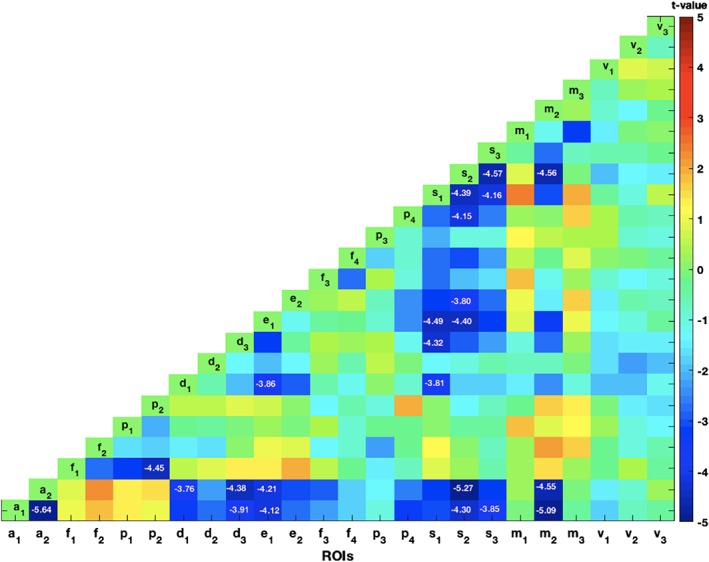
The statistical t‐map showing the patient‐control differences in the functional connectivity (FC) for each pair of regions of interest (ROIs) in between‐network connectivity analysis. The t values for the ROI pairs, statistically significant after Bonferroni multiple comparisons correction, were displayed. These ROI pairs showed reduced FC in patient sample [Color figure can be viewed at http://wileyonlinelibrary.com]