
Figure 6.
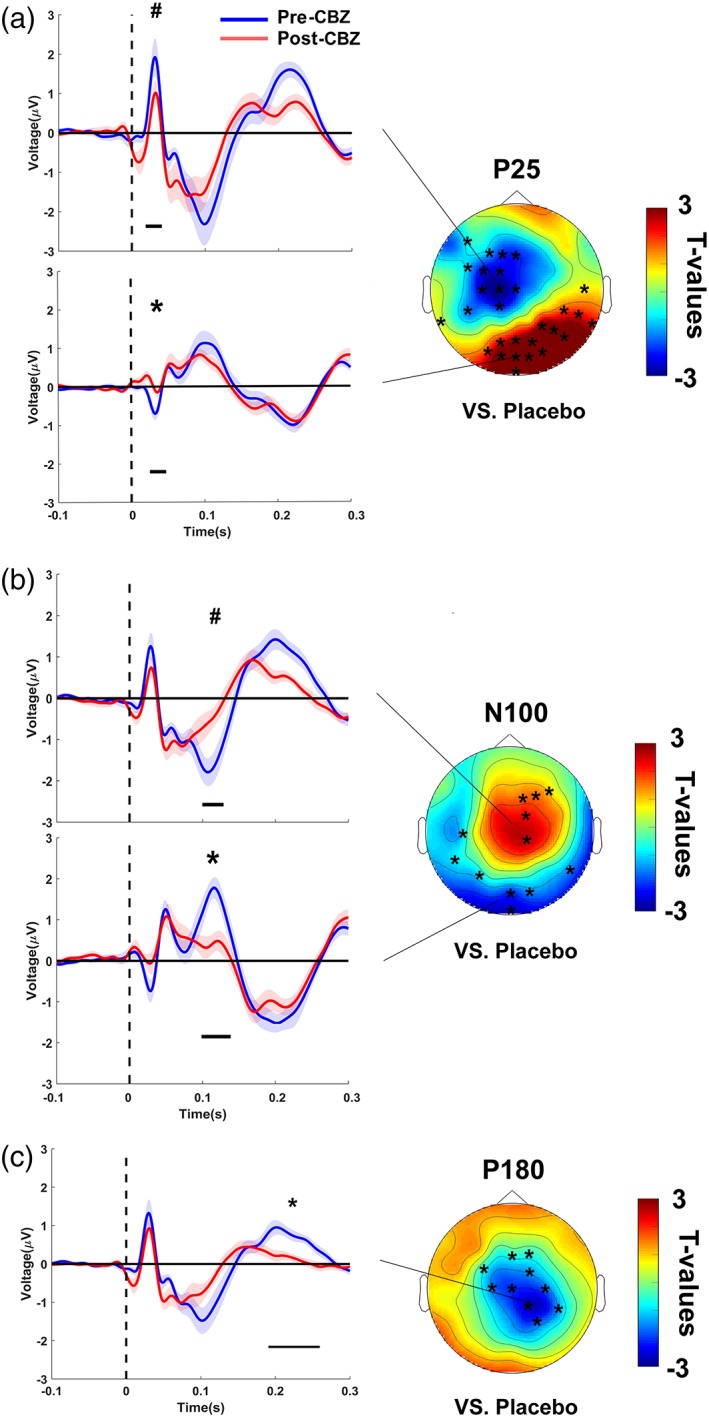
Carbamazepine‐induced changes of TEPs. CBZ decreased the (a) P25, (b) N100 and (c) P180 TEP components. TEPs (shadings: ± 1 SEM) plotted for grand averages of those channels constituting a cluster of significant differences versus baseline (post‐CBZ – pre‐CBZ), separately for predrug (blue) and postdrug (red) measures. Horizontal black bars underneath the TEPs denote the significant clusters in time (*p < .05, # p < .1). T‐statistic maps of the TEP amplitude plotted versus placebo (CBZ [post–pre] vs. placebo [post–pre]). Channels constituting significant clusters of changes in this interaction are indicated by asterisks in the t‐statistic maps [Color figure can be viewed at http://wileyonlinelibrary.com]