
Figure 12.
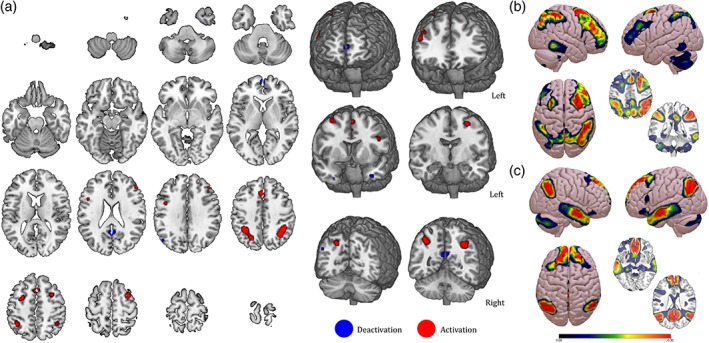
Increase and decrease during the n‐back task. (a) Activation (red) and deactivation (blue) nodes resulting from the analysis conducted on 15 articles. (b,c) Functional connectivity maps for the activation and deactivation nodes, respectively [Color figure can be viewed at http://wileyonlinelibrary.com]