
Figure 3.
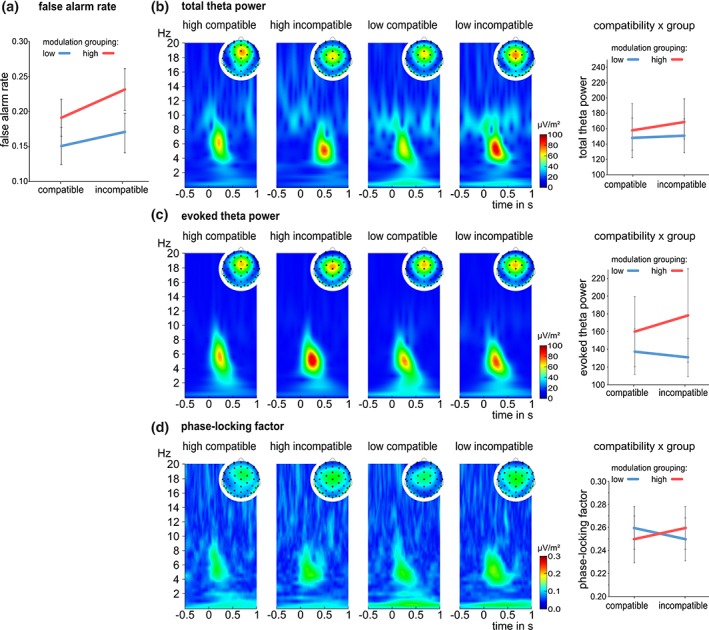
Behavioral and neurophysiological data of the modulation grouping during Nogo trials: (a) false alarm rate in compatible vs. incompatible trials for the low modulation group (blue) and the high modulation group (red). (b–d) time‐frequency decomposition plots of total theta power (b), evoked theta power (c) and PLF (d) for highmodulation and lowmodulation group in compatible and incompatible conditions. Plots are shown for correct rejected responses during Nogo trials at electrode Cz with the corresponding topographies. The x‐axis denotes time in seconds (s) relative to stimulus onset, the y‐axis displays frequency in hertz (Hz). Power is indicated by color. The interaction between compatibility and group is shown, additionally [Color figure can be viewed at http://wileyonlinelibrary.com]