
Figure 1.
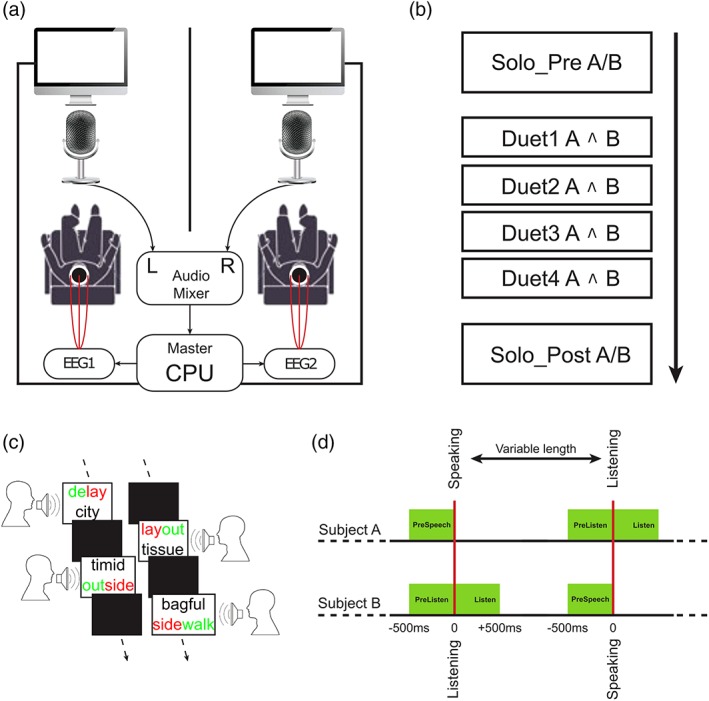
(a) Graphical depiction of the experimental setup. (b) Schematic illustration of the experimental timeline including two solo recordings before and after four duet sessions. Here, a/b indicates recording the speech of a and b separately, whereas a ^ B means recording of both together. (c) An example of the sequences of words produced during the verbal domino task by the two speakers. (d) Schematic illustration of the triggers for the EEG signals (red) and the temporal windows considered for the analyses (green) [Color figure can be viewed at http://www.wileyonlinelibrary.com]