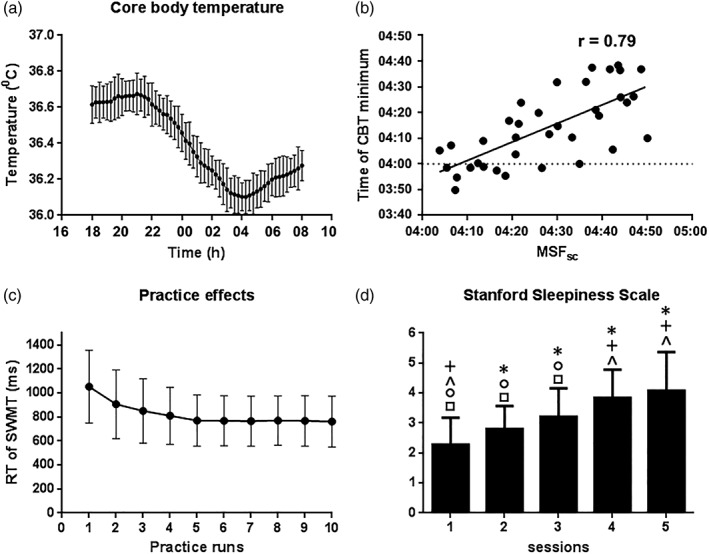
Figure 1.

Figure 1a showed the raw core body temperature curves for the participants. Round symbols show 15‐min averages with standard error bars. Figure 1b showed the correlation between individual MSFSC and individual time of core body temperature minimum. Figure 1c Indicated the training effects for SWMT RT. repeated measures ANOVA showed significant training effects during the first five practices, the SWMT RT reached a stable level after five times of practice. Figure 1d indicated the behavioral results for the SSS. Repeated measures ANOVA showed a main effect of session for the SSS. Posthoc t tests were also performed to test for changes between sessions. * indicate a significant difference between the labeled session and Session 1 (e.g., Session 4 labeled by an asterisk indicates a significant difference in SSS between Sessions 4 and 1); + indicate a significant difference between the labeled session and Session 2; ^ indicate a significant difference between the labeled session and Session 3; ○ indicate a significant difference between the labeled session and Session 4; □ indicate a significant difference between the labeled session and Session 5. Abbreviation: MSFSC, mid‐sleep time on free days, corrected for sleep debt on work days
