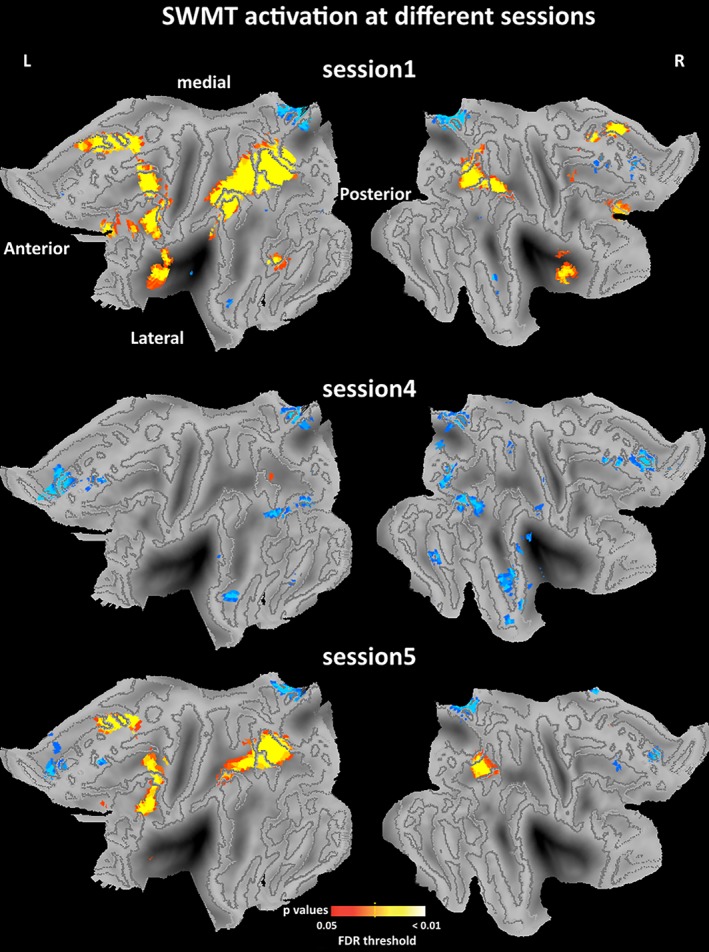
Figure 4.

One‐sample imaging results for the SWMT in different sessions. One‐sample t contrast was specified using the SwE contrast manager. The threshold was set at pFDR <0.05 corrected for multiple comparisons. Statistical maps were projected onto the flattened left and right hemisphere of the population average landmark‐ and surface‐based atlas in CARET software. Anterior, posterior, medial, and lateral directions are noted. Blue color refers to some deactivations in brain regions within default mode network. Abbreviation: SWMT, Sternberg working memory task [Color figure can be viewed at http://wileyonlinelibrary.com]
