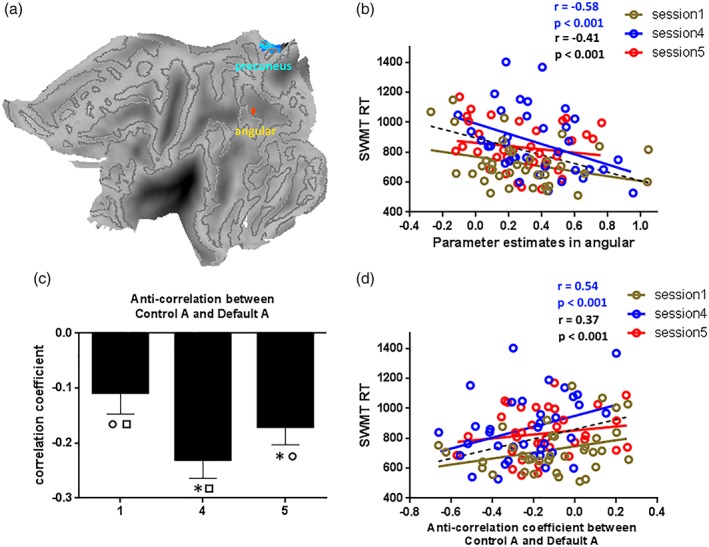
Figure 6.

Correlation results for RT of SWMT. Figure 5a indicated the overlapping regions for one‐sample imaging results in different sessions. Figure 5b indicated the correlation results between the parameter estimates in angular and SWMT RT in three sessions, the correlation result was only significant in Session 4. Figure 5c indicated the ANOVA result for anti‐correlation between control A and default A. Figure 5d indicated the correlation results between the anti‐correlation coefficient and SWMT RT in three sessions, the correlation result was only significant in Session 4. * indicate a significant difference between the labeled session and Session 1; ○ indicate a significant difference between the labeled session and Session 4; □ indicate a significant difference between the labeled session and Session 5. Abbreviations: RT, reaction time; SWMT, Sternberg working memory task [Color figure can be viewed at http://wileyonlinelibrary.com]
