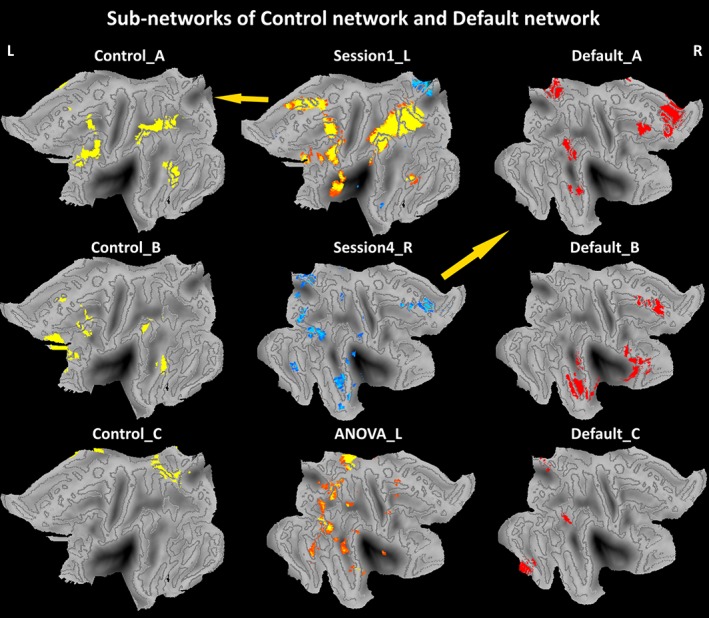
Figure 7.

Sub‐networks of control network and default network. Those maps were projected onto the flattened left hemisphere of the population average landmark‐ and surface‐based atlas in CARET software. Abbreviations: L, left; R, right [Color figure can be viewed at http://wileyonlinelibrary.com]
