
Figure 4.
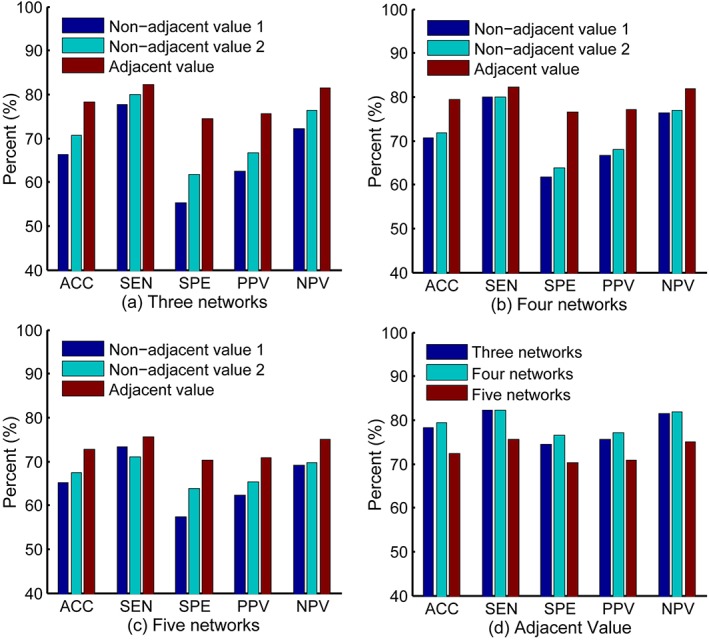
Classification performance of multiple network fusion with 3 (a), 4 (b), and 5 (c) networks in three parameter optimization ways (i.e., non‐adjacent value 1, non‐adjacent value 2, and adjacent value). (d) Performance comparison of 3, 4, and 5 networks when adopting adjacent value method. ACC, accuracy; SEN, sensitivity; SPE, specificity; PPV, positive predictive value; NPV, negative predictive value [Color figure can be viewed at http://wileyonlinelibrary.com]