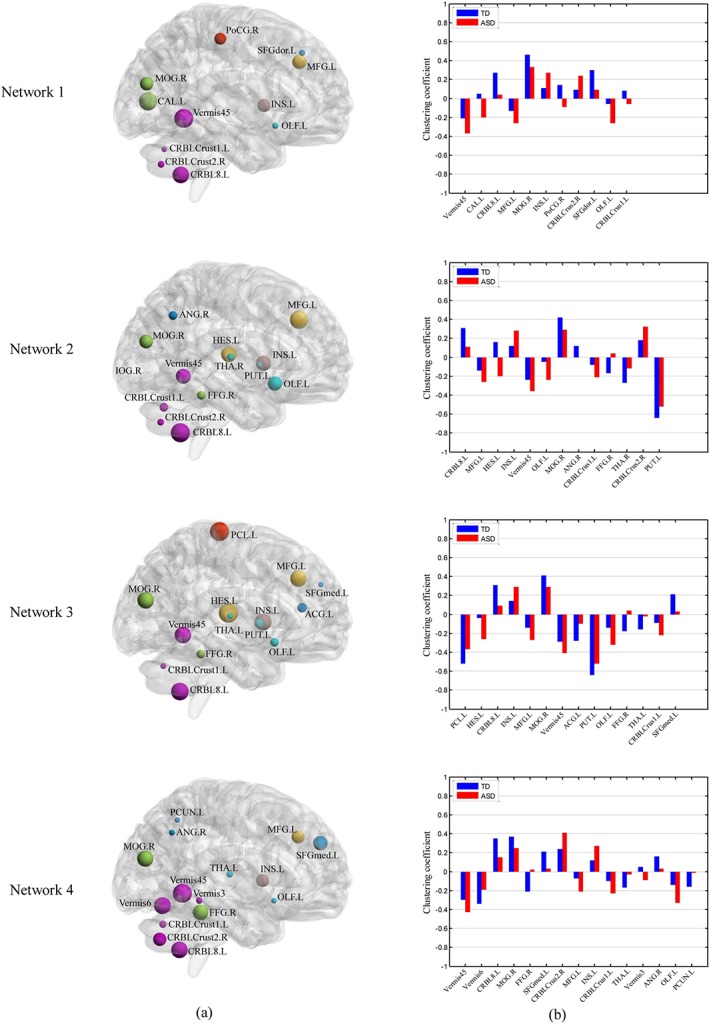
Figure 6.

Contribution (a) and mean clustering coefficient (b) of discriminative ROIs between ASD and TD children in four FCNs. The abbreviations of the ROIs can be found in Table A1. The contributions of ROIs are visualized on a brain surface rendering and are proportional to the sizes of spheres in (a). The ROIs are related with different functional networks represented by different colors (blue: default mode network; yellow: executive attention network; green: visual network; red: sensorimotor network; brown: cingulo‐opercular network; cyan: subcortical regions; violet: regions in the cerebellum). (b) shows the comparison of the normalized mean clustering coefficient between the TD and ASD children [Color figure can be viewed at http://wileyonlinelibrary.com]
