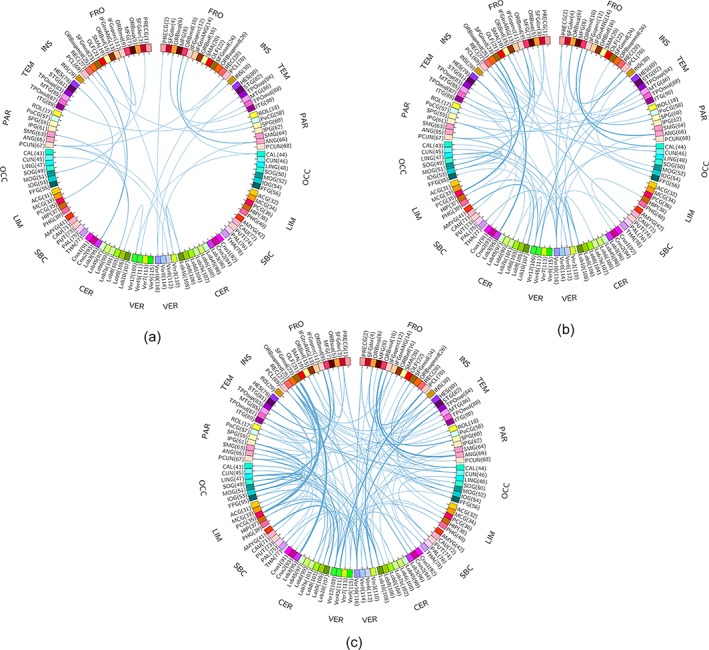
Figure 8.

Topological differences between three FCNs [with regularization parameter λ as 0.08 (a), 0.07 (b), and 0.06 (c), respectively] and the FCN (λ = 0.09). Compared with the FCN (λ = 0.09) as benchmark, the number of extra links from three FCNs increases with the decrease of λ. The thickness of links represents the weights of connections from other ROIs to a specific ROI. The abbreviations of the ROIs can be found in Table A1 [Color figure can be viewed at http://wileyonlinelibrary.com]
