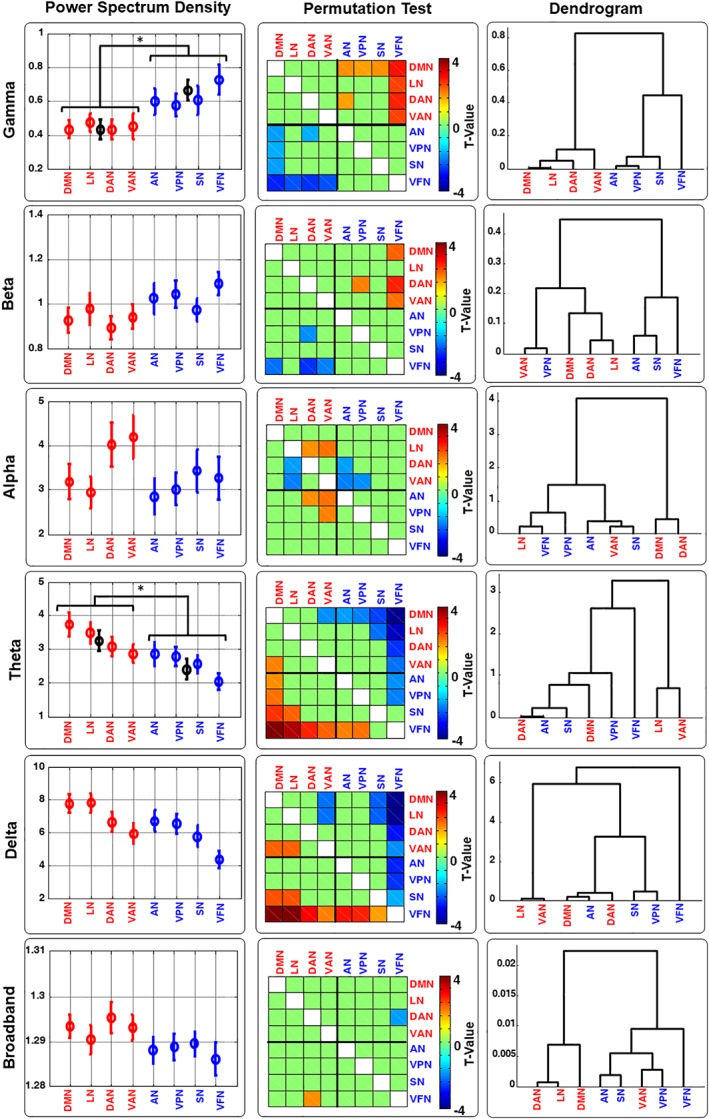
Figure 2.

The band‐limited power of EEG‐derived RSNs. The band‐limited power Power Spectrum Density (PSD, the empty circle indicates the grand average across subjects and the vertical lines indicates the standard error [SE]). Dendrogram and permutation t‐test across all RSNs and across all bands (Delta, Theta, Alpha, Beta, Gamma, and Broadband) are shown. PSD and Permutation Test values are shown based on the sorted values obtained for the dendrogram in gamma band. For the PSD is also shown the average values and SE for the two groups HCNs (DMN, LN, DAN, and VAN) and PNs (AN, VPN, SN, and VFN) in all the case those two groups show significant difference (* indicate p < .05) [Color figure can be viewed at http://wileyonlinelibrary.com]
