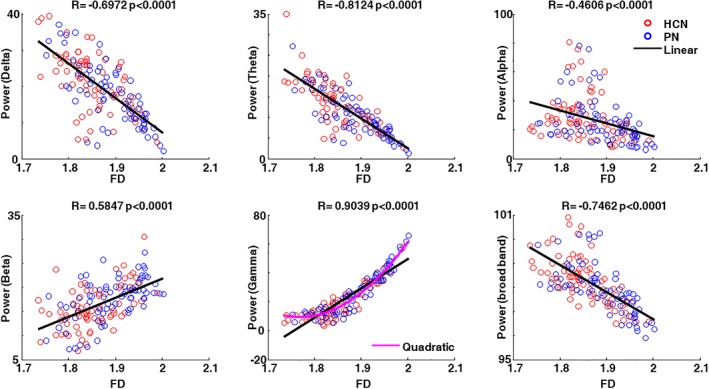
Figure 5.

Correlation between FD and band‐limited power. Single subject Spearman correlation between FD and band‐limited power in delta, theta, alpha, beta, gamma, and broad bands. The red circle indicates HCNs and the blue circle indicates PNs. The black line indicates the linear fitting and the magenta line indicates the quadratic fitting using band‐limited power as a function of FD. The R and p values are reported on top of each subplot [Color figure can be viewed at http://wileyonlinelibrary.com]
