
Figure 1.
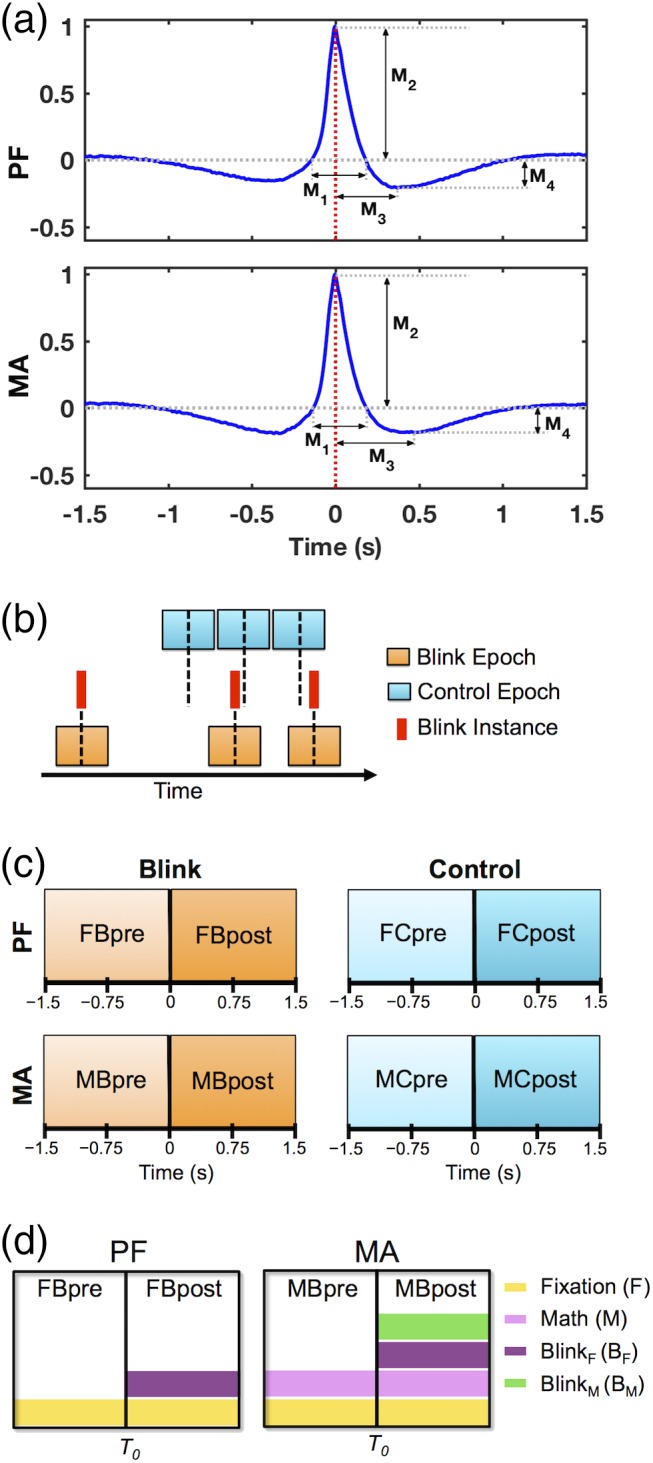
Data preprocessing. (a) Grand average of 3 s blink epochs in vEOG data showing the quantitative morphological features used to evaluate behavioral characteristics across individuals. Features delineate the height and width of positive and negative regions within the blink trace. M1 = positive peak width; M2 = positive peak amplitude; M3 = negative peak time; M4 = negative peak amplitude. Red dotted line at 0 ms denotes the latency of maximum blink amplitude or T 0, corresponding to the moment of complete eye closure. (b) Schematic illustration of data segmentation technique. Blink epochs were centered on the latency of blink maximum (T 0) for each blink event, while the control epochs were pseudo‐random in timing with respect to blink instances. Number of trials was identical between control and blink conditions for each task and subject. Black dotted line represents time zero for each condition. (c) Schematic illustration of data segments used for statistical contrasts, corresponding to intervals before and after time zero for each condition and task. (d) Schematic illustration of key experimental factors in this study, applicable to the blink condition for PF and MA tasks. Rectangular boxes represent whole 3 s epochs, with central black lines denoting T 0. The effect of fixation (F) is common to both PF and MA tasks throughout the entire blink epochs, while the effect of mental calculation or math (M) is present throughout the epoch in MA. The effect of blinking has been decomposed into blink F (B F ) and blink M (B M ), representing blinking under fixation and blinking under calculation, respectively. The former applies to both the PF and MA tasks as they both utilize visual fixation, while the latter applies only to the MA task. In both cases, the blink‐related effects primarily manifest in the post‐blink intervals