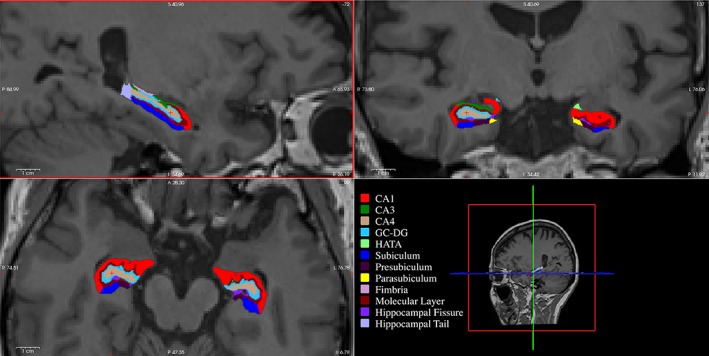
Figure 2.

Hippocampal subfield segmentation using Freesurfer v 6.0 overlaid on a structural MRI scan to provide anatomical context. Three sections are shown: sagittal view of the left hippocampus (top left), coronal view of the both hippocampi (top right), and axial view of both hippocampi (bottom left). Each subfield is colored distinctly (bottom right). CA, Cornu Ammonis; GC‐DG, granular cell layer within the dentate gyrus; HATA, hippocampus–amygdaloid transition area [Color figure can be viewed at http://wileyonlinelibrary.com]
