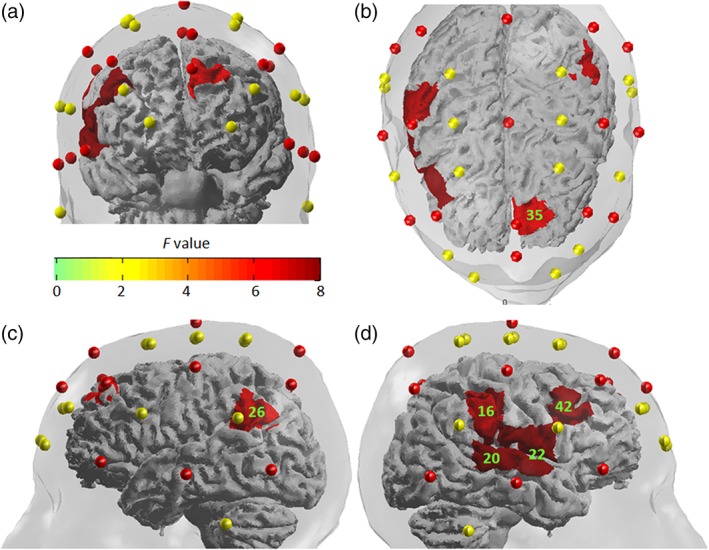
Figure 3.

The F‐statistic map showing brain regions that had significantly different activations among the four conditions (neutral, fearful, angry, and happy prosody). Reported F values are thresholded by q < 0.05 (corrected for multiple comparisons using FDR). (a) Front view. (b) Top view. (c) Left view. (d) Right view. Green labels denote the number of channels [Color figure can be viewed at http://wileyonlinelibrary.com]
