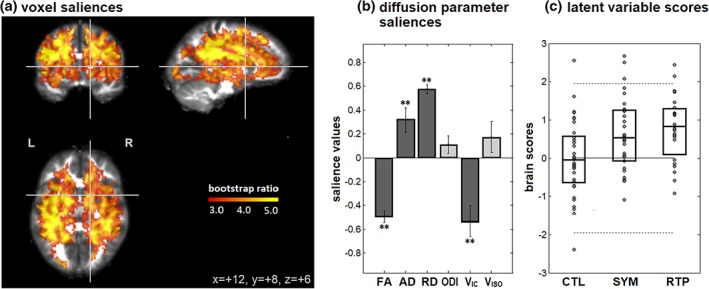
Figure 2.

Brain regions and diffusion parameters that distinguish between athlete groups, including uninjured controls (CTL) and concussed athletes while symptomatic (SYM) and at medical clearance to return to play (RTP), based on multivariate NPLS analysis. For the single significant component, we report (a) regions with significant voxel saliences. (b) Diffusion parameter saliences that distinguish between groups in these brain regions, with error bars denoting bootstrap standard error. Significant saliences are denoted by “**.” (c) Brain scores, indicating how much each subject expresses this salience pattern, along with distribution quartiles for each athlete group. The solid horizontal line = mean of CTL group scores, along with 95% confidence bounds (dashed lines), for evaluation of individual datapoints. The brain map is shown as maximum intensity projections (MIPs) in sagittal, coronal and axial planes, centered on MNI coordinates (x = +12, y = +8, z = +6) [Color figure can be viewed at http://wileyonlinelibrary.com]
