Figure 2.

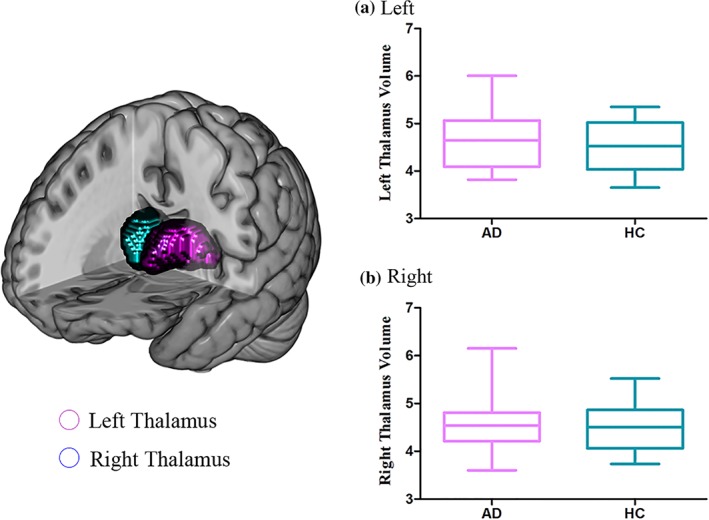
Comparisons of the thalamus volumes between alcohol‐dependent patients and controls. No significant group effect on the normalized left thalamus and right thalamus [Color figure can be viewed at http://wileyonlinelibrary.com]

Comparisons of the thalamus volumes between alcohol‐dependent patients and controls. No significant group effect on the normalized left thalamus and right thalamus [Color figure can be viewed at http://wileyonlinelibrary.com]