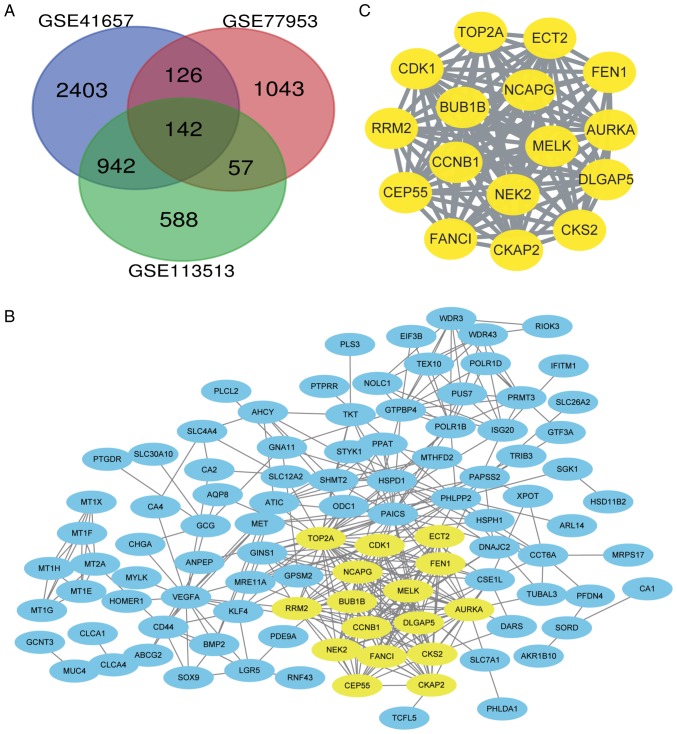
Figure 1.
DEGs between CRC and non-tumour tissues. (A) Venn diagram of the DEGs in the three data sets (GSE41657, GSE77953, and GSE113513). Log fold change >1 and adjusted P-value <0.01 were the conditions for screening DEGs. A total of 142 DEGs were screened. (B) PPI network of 142 DEGs. Yellow indicates the densest module. (C) The relationships among the most important module genes in the PPI network. DEGs, differentially expressed genes; CRC, colorectal cancer; PPI, protein-protein interaction.

