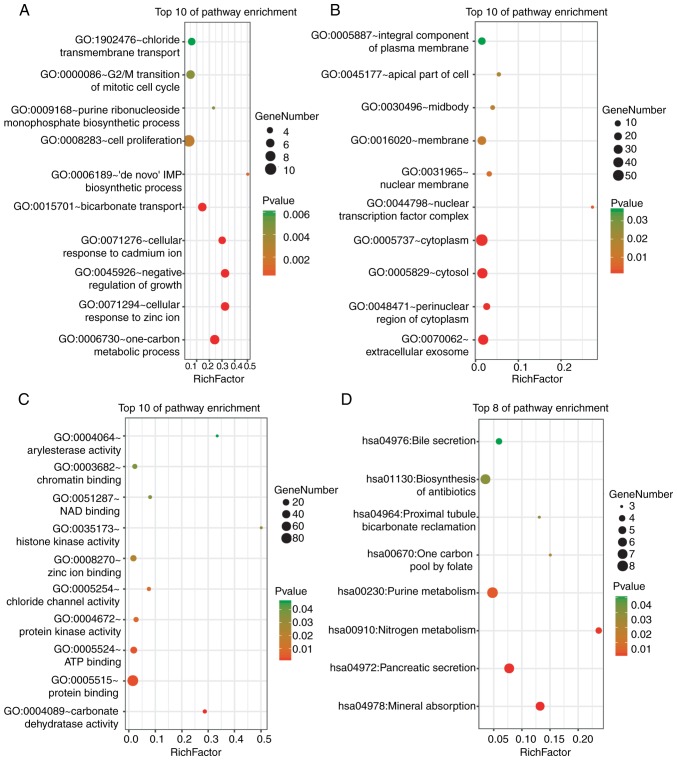
Figure 2.
GO and KEGG pathway enrichment analysis of the DEGs. (A) The enrichment of biological processes. (B) The enrichment of cellular components. (C) The enrichment of molecular functions. (D) The enrichment analysis of the KEGG pathways. P<0.05 was considered to indicate a statistically significant difference. GO, gene ontology; KEGG, Kyoto Encyclopedia of Genes and Genomes; DEGs, differentially expressed genes.

