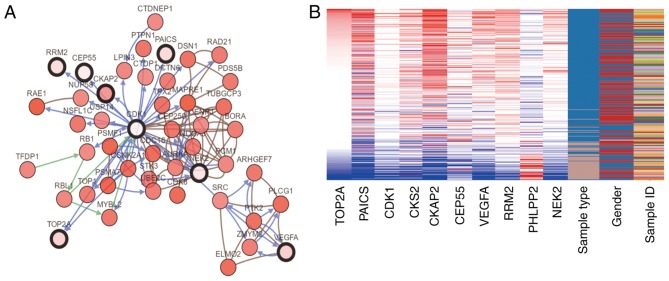
Figure 3.
Interaction network of hub genes and hierarchical cluster analysis. (A) Analysis of the hub genes and their co-expressed genes using cBioPortal. (B) Hierarchical clustering of the hub genes. In the sample type column, brown samples are non-cancerous tissue samples, and blue samples are CRC tissue samples. In the gene expression columns, red indicates upregulated expression and blue indicates downregulated expression. CRC, colorectal cancer.

