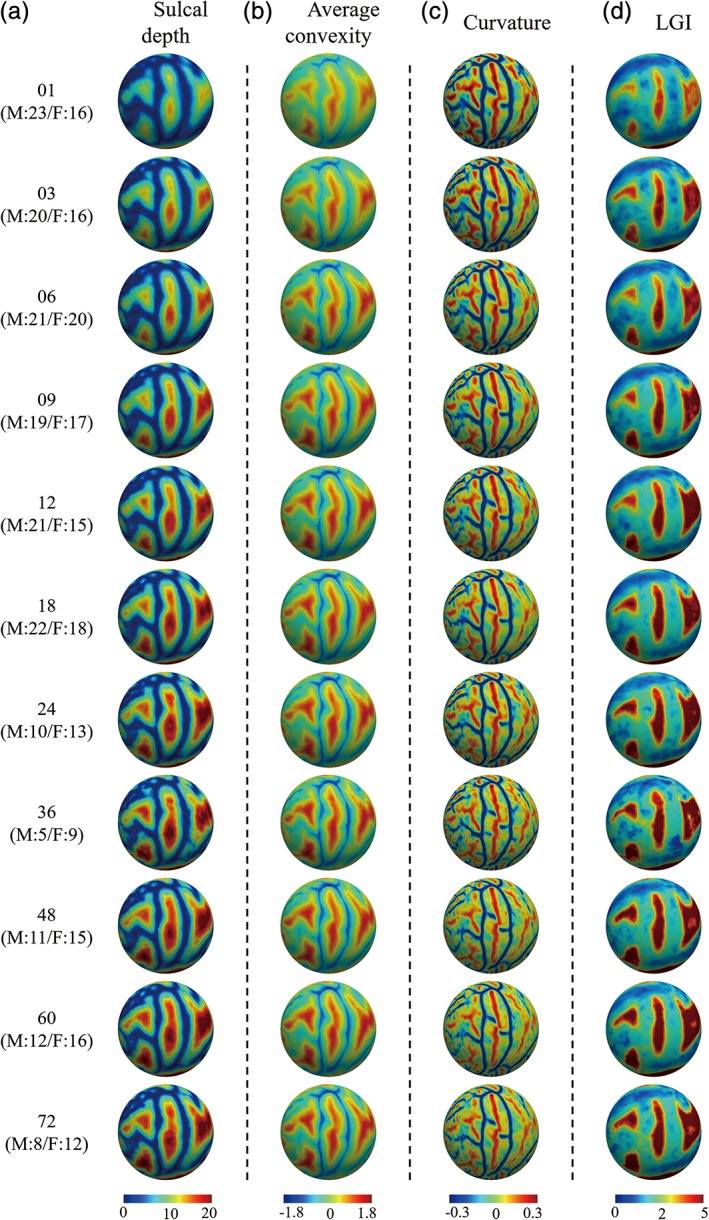
Figure 6.

The constructed 4D infant cortical surface atlases of the left hemisphere, with different cortical attributes shown on the spherical surface. Numbers on the left denote the month(s) of age and the subjects number, with M indicating male, and F indicating female. (a) Sulcal depth. (b) Average convexity. (c) Curvature. (d) Local gyrification index (LGI) [Color figure can be viewed at http://wileyonlinelibrary.com]
