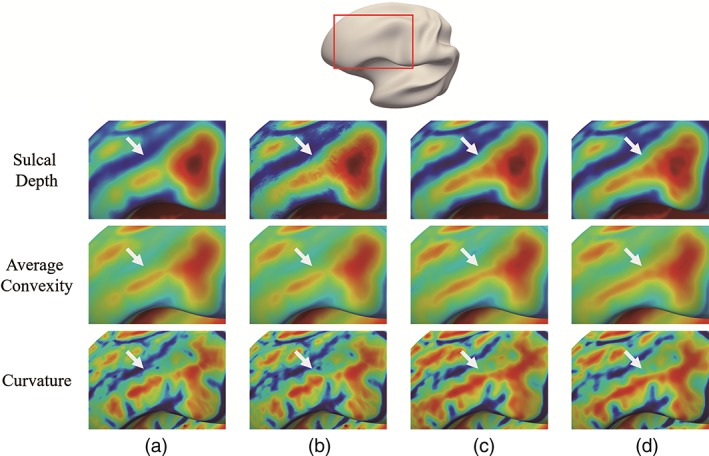
Figure 9.

Comparison of zoomed cortical attribute patterns at one cortical region of 4 (12‐month atlas, left hemispherical) comparison atlases. In the top of this figure, the original region location in the inflated cortical surface is indicated by the red rectangle. Each row shows the specific cortical attribute on different atlases. (a) Two‐step registration atlas. (b) Top M patch‐based atlas. (c) Independent sparse atlas. (d) Group‐wise sparse atlas (our atlas) [Color figure can be viewed at http://wileyonlinelibrary.com]
