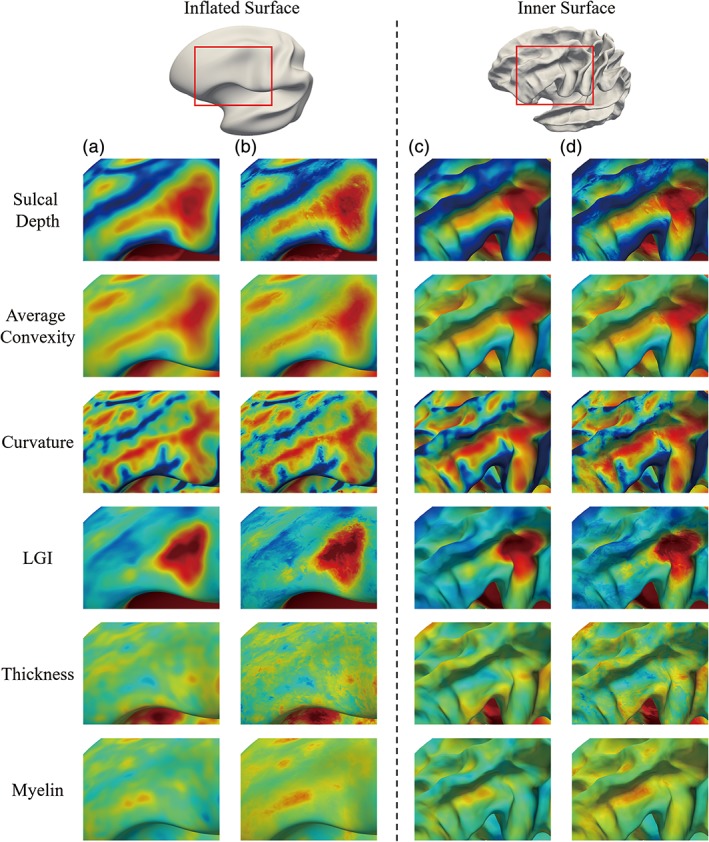
Figure 10.

Comparison of the cortical attribute patterns with two different fusion strategies. The comparisons of patterns are demonstrated on the inflated and the average inner cortical surface, respectively. The red rectangles on the inflated and average inner cortical surfaces indicate the same zoomed region location. Each row corresponds to a specific cortical attribute. Columns (a) and (c) show the results with the second fusion strategy (proposed method), while (b) and (d) show results with the first fusion strategy (i.e., without fusion) [Color figure can be viewed at http://wileyonlinelibrary.com]
