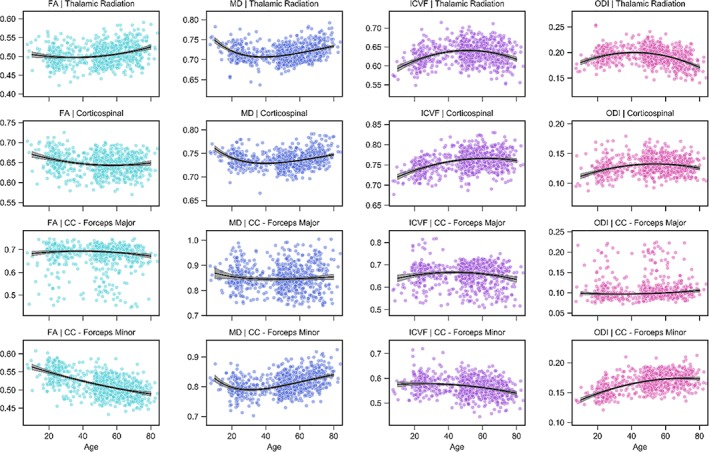
Figure 6.

Projection and callosal fiber trajectories for FA, MD, ICVF, and ODI. Scatterplots indicate the tract microstructure measurement distribution across the sample with age; black lines denote the aging regression line for quadratic (FA, ICVF, ODI) or Poisson curve (MD) models (gray shading 95% CI). Light blue: FA; dark blue: MD; purple: ICVF; pink: ODI. CC: corpus callosum [Color figure can be viewed at http://wileyonlinelibrary.com]
