
Figure 1.
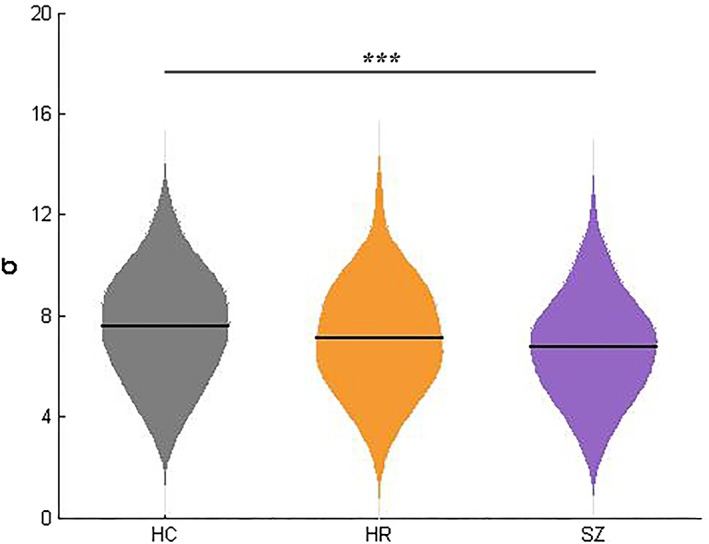
Differences in global network parameter σ among three groups. The violin plots represent the distribution of global network parameter σ in each group and the solid lines indicate the mean value in HC, HR, and SZ. Significance level was set as p < 0.05. ***, p < 0.001. HC = healthy control; HR = high risk; SZ = schizophrenia