
Figure 2.
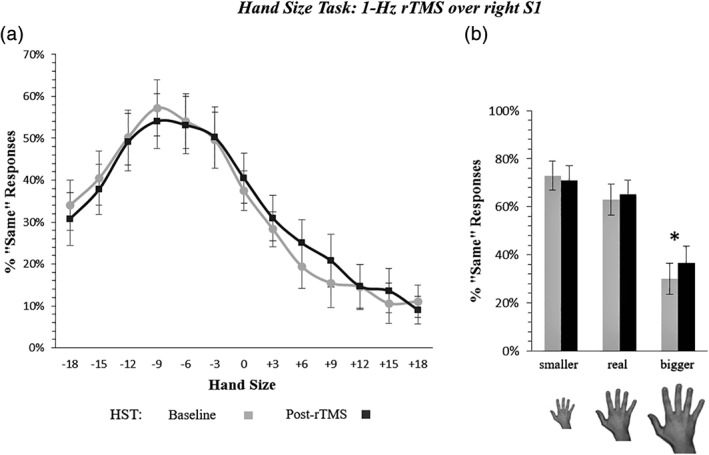
Hand size perceived change by 1‐Hz rTMS of the right S1 hand area (experiment 1). Panel (a) shows the increase of «Same» responses after right S1 rTMS in trials presenting a hand bigger than the participant's real hand, regardless of the hand laterality (Time x Hand Size interaction, p = .01). The x axis = mean percentage of the hand size change, with negative values corresponding to a reduction of the hand size, positive values to an increase; y axis = percentage of «Same» responses. Gray line = participants' performance before 1‐Hz rTMS (baseline); black line = performance after 1‐Hz rTMS (post‐rTMS). Panel (b) recaps the overestimation effect. Error bars represent the standard error of the mean (SEM); * = significant difference (p < .05) between pre‐ and post‐rTMS assessment