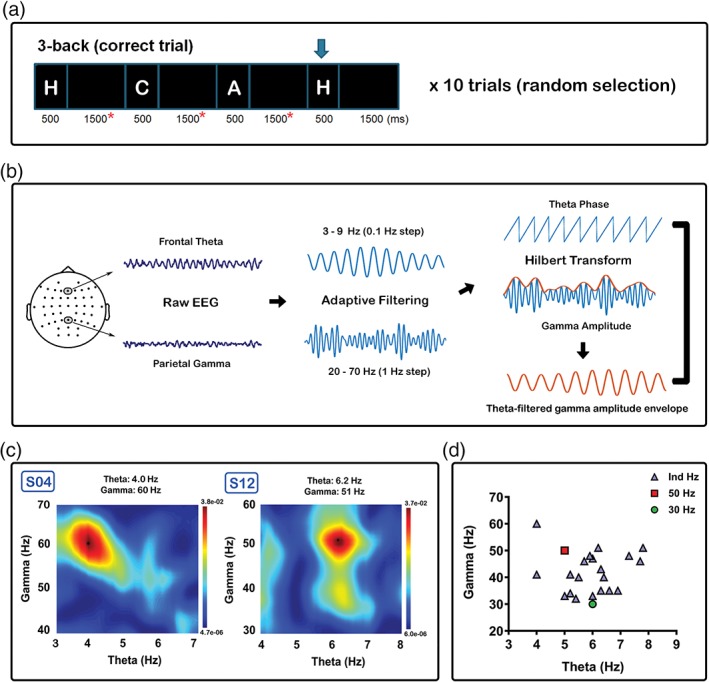
Figure 2.

Procedures involved in the selection of the individualised frequency of iTBS. (a) Ten random correct trials selected for theta‐gamma coupling (TGC). Only data from the maintenance period of each epoch (red asterisks) were included in the calculation to avoid spurious coupling resulting from the visual‐evoked response and edge effects. (b) Raw data from Fz electrode was chosen as the modulating frequency (theta), and Pz electrode as the modulated frequency (gamma). Data were filtered (adaptive) in the frequency range in multiple steps and Hilbert transform was applied to obtain phase (theta) and amplitude (gamma). Theta‐filtered gamma amplitude envelope was extracted prior to phase‐amplitude coupling estimation using general linear model. (c) Comodulogram illustrated for two subjects (S04 and S12). Peak was detected using the maximum value in the frequency ranges of interest (4–8 Hz for theta, 30–60 Hz for gamma). (d) Values used for individualised iTBS in blue triangle, 50 Hz iTBS in red rectangle, and 30 Hz iTBS in green circle [Color figure can be viewed at http://wileyonlinelibrary.com]
